

doi: 10.1126/science.1139207.
Temporal frequency of subthreshold oscillations scales with entorhinal grid cell field spacing
Affiliations
- PMID: 17379810
- PMCID: PMC2950607
- DOI: 10.1126/science.1139207
Item in Clipboard
Temporal frequency of subthreshold oscillations scales with entorhinal grid cell field spacing
Science.
.
Abstract
Grid cells in layer II of rat entorhinal cortex fire to spatial locations in a repeating hexagonal grid, with smaller spacing between grid fields for neurons in more dorsal anatomical locations. Data from in vitro whole-cell patch recordings showed differences in frequency of subthreshold membrane potential oscillations in entorhinal neurons that correspond to different positions along the dorsal-to-ventral axis, supporting a model of physiological mechanisms for grid cell responses.
Figures
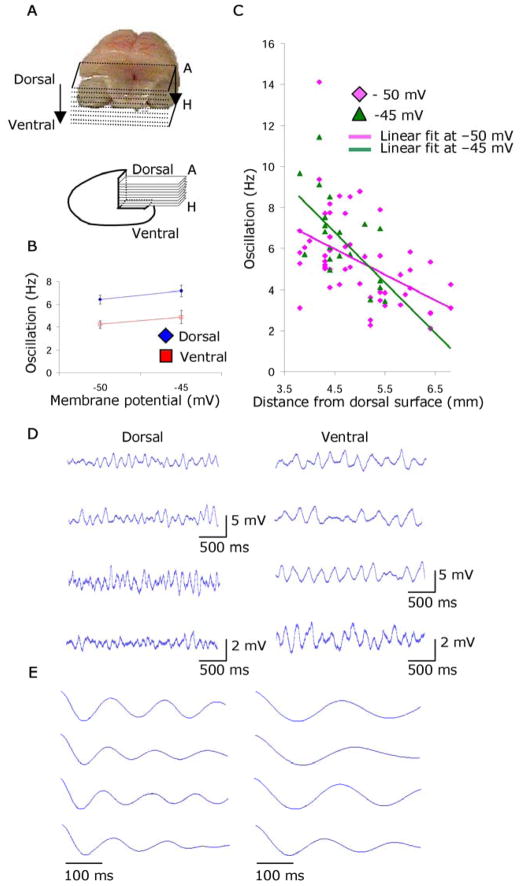
Higher frequency of subthreshold oscillations in dorsal versus ventral entorhinal cortex. A. Top: Dorsal view of brain after slicing. Bottom: Sagittal view showing anatomical location of horizontal slices A to H. B. Mean frequency of subthreshold oscillations for neurons from dorsal slices (3.8 – 4.9 mm Bregma) and ventral slices (4.9 – 7.1 mm Bregma) at −50 mV and −45 mV. C. Subthreshold oscillation frequency plotted versus anatomical distance from dorsal surface. D. Examples of subthreshold oscillations at −50 mV in dorsal regions (left) and ventral regions (right). E. Corresponding autocorrelations used to measure frequency in D.
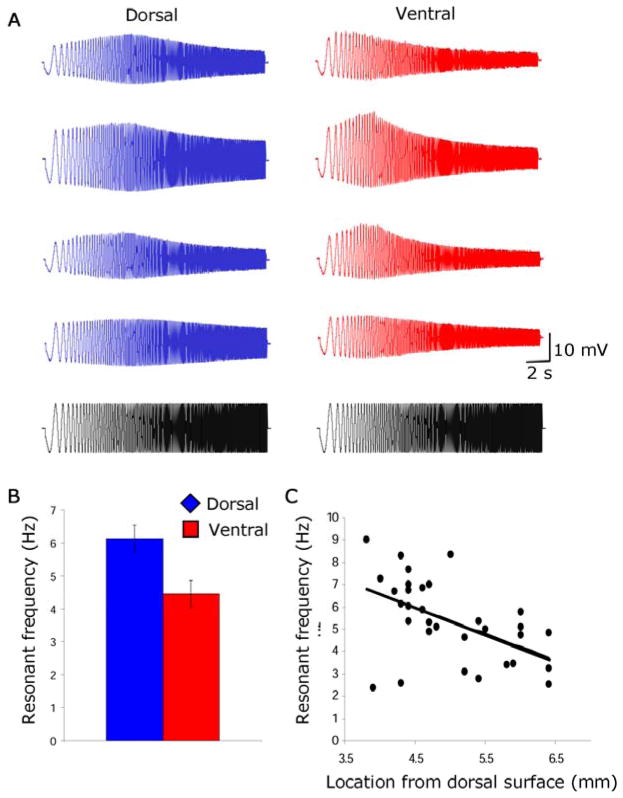
Differences in resonance properties of neurons in dorsal versus ventral entorhinal cortex. A. Examples of resonance responses of neurons in dorsal (blue traces) and ventral entorhinal cortex (red traces) in response to impedance amplitude profile (ZAP) stimulus (black). B. Histogram of mean peak resonance frequency for neurons in dorsal versus ventral entorhinal cortex. C. Resonance frequency plotted versus anatomical distance from the dorsal surface.
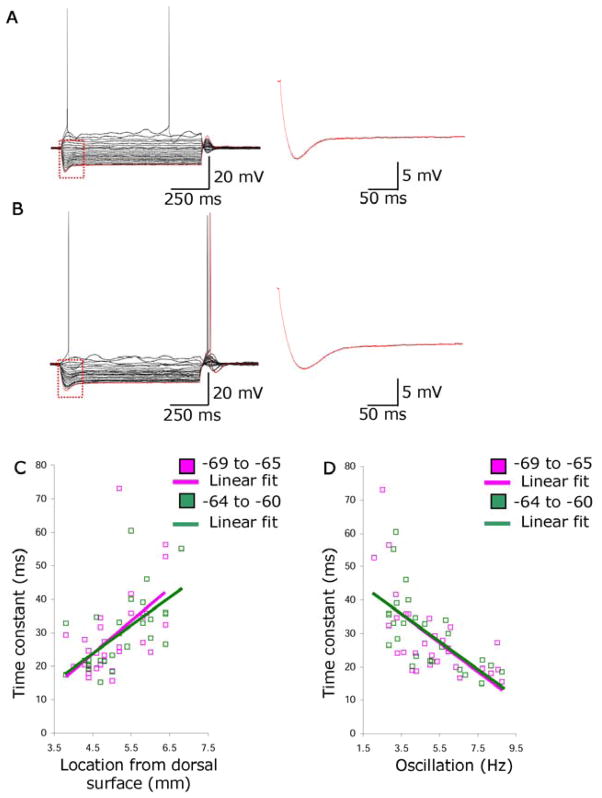
Relationship of subthreshold membrane potential oscillations to sag potential. For single neurons in dorsal (A) and ventral entorhinal cortex (B), traces on left show membrane potential responses to multiple current injection levels. Single traces (right) show sag potentials at higher resolution. C. First time constant of sag potential (ms) plotted versus anatomical location. D. Time constant of sag potential plotted versus subthreshold oscillation frequency.
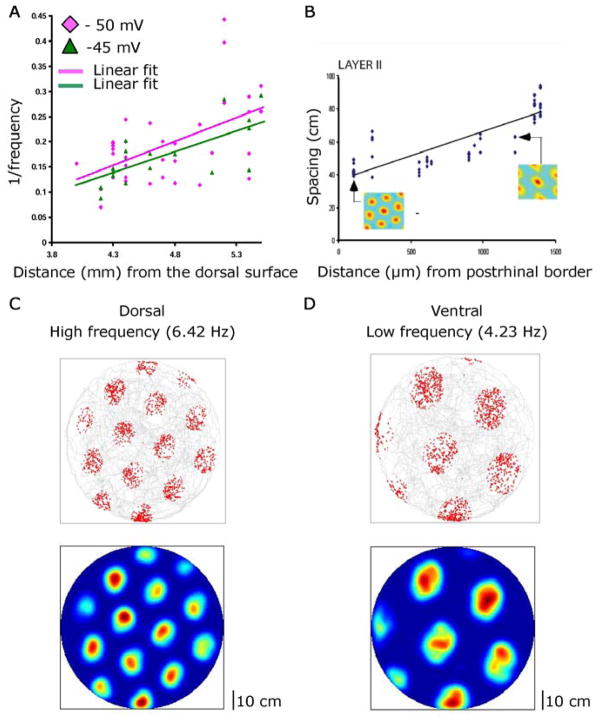
Subthreshold oscillations may underlie differences in grid field spacing. A. Reciprocal of oscillation frequency plotted versus anatomical depth for anatomical range matching a previous publication (7) as shown in B. C–D. Simulation of grid cell model (3, 8). Top: Gray indicates trajectory of simulated rat. Red indicates firing locations. Bottom: Firing rate map (red=maximum, blue=no spikes). Grid field spacing is small for mean dorsal oscillation frequency of 6.42 Hz (C) and larger for mean ventral frequency of 4.23 Hz (D).
Similar articles
-
Frequency of subthreshold oscillations at different membrane potential voltages in neurons at different anatomical positions on the dorsoventral axis in the rat medial entorhinal cortex.J Neurosci. 2011 Aug 31;31(35):12683-94. doi: 10.1523/JNEUROSCI.1654-11.2011. J Neurosci. 2011. PMID: 21880929 Free PMC article.
-
Physiological Properties of Neurons in Bat Entorhinal Cortex Exhibit an Inverse Gradient along the Dorsal-Ventral Axis Compared to Entorhinal Neurons in Rat.J Neurosci. 2016 Apr 20;36(16):4591-9. doi: 10.1523/JNEUROSCI.1791-15.2016. J Neurosci. 2016. PMID: 27098700 Free PMC article.
-
Cholinergic modulation of the resonance properties of stellate cells in layer II of medial entorhinal cortex.J Neurophysiol. 2010 Jul;104(1):258-70. doi: 10.1152/jn.00492.2009. Epub 2010 May 5. J Neurophysiol. 2010. PMID: 20445030 Free PMC article.
-
Time constants of h current in layer ii stellate cells differ along the dorsal to ventral axis of medial entorhinal cortex.J Neurosci. 2008 Sep 17;28(38):9414-25. doi: 10.1523/JNEUROSCI.3196-08.2008. J Neurosci. 2008. PMID: 18799674 Free PMC article.
-
How to build a grid cell.Philos Trans R Soc Lond B Biol Sci. 2013 Dec 23;369(1635):20120520. doi: 10.1098/rstb.2012.0520. Print 2014 Feb 5. Philos Trans R Soc Lond B Biol Sci. 2013. PMID: 24366132 Free PMC article. Review.
Cited by
-
The neural encoding of space in parahippocampal cortices.Front Neural Circuits. 2012 Aug 17;6:53. doi: 10.3389/fncir.2012.00053. eCollection 2012. Front Neural Circuits. 2012. PMID: 22912603 Free PMC article. No abstract available.
-
Democracy-independence trade-off in oscillating dendrites and its implications for grid cells.Neuron. 2010 May 13;66(3):429-37. doi: 10.1016/j.neuron.2010.04.027. Neuron. 2010. PMID: 20471355 Free PMC article.
-
Tuning Neural Synchronization: The Role of Variable Oscillation Frequencies in Neural Circuits.Front Syst Neurosci. 2022 Jul 8;16:908665. doi: 10.3389/fnsys.2022.908665. eCollection 2022. Front Syst Neurosci. 2022. PMID: 35873098 Free PMC article. Review.
-
Saccade Velocity Driven Oscillatory Network Model of Grid Cells.Front Comput Neurosci. 2019 Jan 10;12:107. doi: 10.3389/fncom.2018.00107. eCollection 2018. Front Comput Neurosci. 2019. PMID: 30687054 Free PMC article.
-
Properties and functional implications of I (h) in hippocampal area CA3 interneurons.Pflugers Arch. 2011 Dec;462(6):895-912. doi: 10.1007/s00424-011-1025-3. Epub 2011 Sep 21. Pflugers Arch. 2011. PMID: 21938402
References
-
- Steffenach HA, Witter M, Moser MB, Moser EI. Neuron. 2005;45:301–13. - PubMed
-
- McNaughton BL, Battaglia FP, Jensen O, Moser EI, Moser MB. Nat Rev Neurosci. 2006;7:663–78. - PubMed
-
- Eichenbaum H, Cohen NJ. From conditioning to conscious recollection. Oxford University Press; New York: 2003.
-
- Hafting T, Fyhn M, Molden S, Moser MB, Moser EI. Nature. 2005;436:801–6. - PubMed
Publication types
MeSH terms
Grants and funding
LinkOut - more resources
Full Text Sources
Other Literature Sources
