. 2007 Jul;37(1):38-47.
doi: 10.1165/rcmb.2006-0353OC. Epub 2007 Mar 22.

Endothelin-1 induces alveolar epithelial-mesenchymal transition through endothelin type A receptor-mediated production of TGF-beta1

Affiliations

Endothelin-1 induces alveolar epithelial-mesenchymal transition through endothelin type A receptor-mediated production of TGF-beta1

Raksha Jain et al. Am J Respir Cell Mol Biol. 2007 Jul.

Abstract

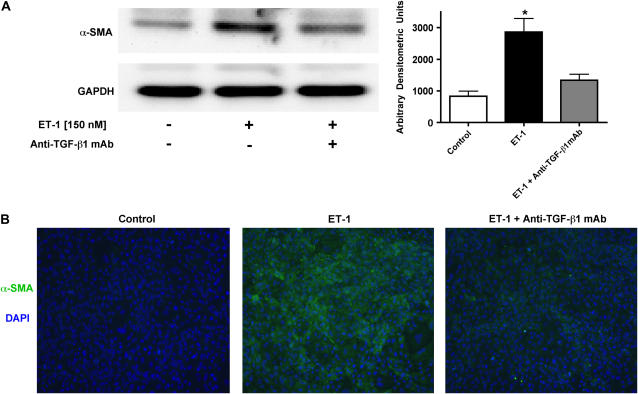
Endothelin-1 (ET-1) is implicated in the pathogenesis of idiopathic pulmonary fibrosis (IPF), but the cellular mechanisms underlying the role it plays in this disease are not well characterized. Epithelial-mesenchymal transition (EMT), which was recently demonstrated in alveolar epithelial cells (AEC), may play an important role in the pathogenesis of IPF and other forms of pulmonary fibrosis. Whether ET-1 contributes to the induction of EMT in AEC is unknown. The aims of this study were to evaluate AEC production of ET-1 and to determine if ET-1 induces EMT in AEC. We demonstrate that ET-1 is produced at physiologically relevant levels by primary AEC and is secreted preferentially toward the basolateral surface. We also demonstrate that AEC express high levels of endothelin type A receptors (ET-A) and, to a lesser extent, type B receptors (ET-B), suggesting autocrine or paracrine function for alveolar ET-1. In addition, ET-1 induces EMT through ET-A activation. Furthermore, TGF-beta1 synthesis is increased by ET-1, ET-1 induces Smad3 phosphorylation, and ET-1-induced EMT is attenuated by a TGF-beta1-neutralizing antibody. Thus, ET-1 is an important mediator of EMT in AEC, acting through ET-A-mediated TGF-beta1 production. These findings increase our basic understanding of the role of ET-1 in pulmonary fibrosis and suggest potential roles for AEC-derived ET-1 in the pathogenesis of other alveolar epithelial-mediated lung diseases.


Figures

<b>Figure 1.</b>
Figure 1.
AEC produce ET-1 and express ET-1 receptors. (A) ELISA analysis of supernatant from primary rat AEC monolayers demonstrates ET-1 production per 24 h at Days 2, 4, and 6 of culture. ET-1 production increased over time and was directed preferentially to the basolateral surface. Values are mean ± SEM (n = 3–5; *P < 0.05 versus apical). (B) Primary AEC stained for lamellar protein (p180, green, Alexa 488) and ET-1 (red, Alexa 594) show ET-1 in the cytoplasm of AEC but in a distinct location from p180. Blue staining represents DAPI-stained nuclei. Deconvoluted high-power images were derived from stacks of images taken at 0.1-μm intervals over a total of 2–3 μm thickness of single cells. The Pearson's coefficient of correlation between p180 and ET-1 was 0.228. (C) Immunoblots for ET-A demonstrated high levels of ET-A in AEC relative to RLF. Immunoblots for ET-B revealed much greater expression of ET-B in endothelial cells (EC) than AEC. Findings by immunoblot analysis were confirmed by three to five independent experiments.
<b>Figure 2.</b>
Figure 2.
TGF-β1 increases ET-1 production from AEC and attenuates its polar basolateral secretion. (A) Supernatant from AEC treated with and without TGF-β1 showed increased total ET-1 production by ELISA at Days 4 and 6. (B) TGF-β1 abrogated the basolateral directionality of the secretion of ET-1 by AEC. On Days 4 and 6 the apical: basolateral ratio of secretion increased from < 0.25 in control AEC to > 0.5 in TGF-β1–treated AEC. (C) ET-1 mRNA abundance evaluated by RT-PCR increased at Day 2 in the presence of TGF-β1 but was not elevated on Day 6. (D) Immunoblot evaluating ET-A receptor expression showed no difference between control versus TGF-β1–treated AEC. Immunoblot evaluating ET-B receptor expression showed an increase in AEC ET-B with TGF-β1. GAPDH was used as a loading control. Immunoblots shown are representative of four to five independent studies. Values are mean ± SEM. *P < 0.05 versus control. Lightly shaded bars, control; darkly shaded bars, TGF-β1.
<b>Figure 3.</b>
Figure 3.
Figure 3. ET-1 induces EMT in AEC via ET-A. (A) Immunofluorescence analysis demonstrated that ET-1 increases α-SMA expression, and that the increase is inhibited by BQ-123, but not BQ-788. AEC treated with ET-1 also changed morphology from a typical rounded shape to an elongated fibroblast-like morphology (phase images, right panels) with prominent intracellular stress fibers (fluorescent images, middle panels). BQ-123 prevented this morphologic change, while BQ-788 did not. For all immunofluorescence images, green staining represents α-SMA and blue staining represents nuclei stained with DAPI. (B) Immunoblot analysis similarly revealed increased α-SMA expression with ET-1 (150 nM) treatment relative to control. BQ-123, an ET-A antagonist, completely abrogated this effect. BQ-788, an ET-B antagonist, had no effect. For immunoblot analysis, one representative blot is shown. Densitometric analysis (right panel) summarizes four separate experiments. *P < 0.05 compared with control and ET-1 + BQ-123. (C) Immunoblot analysis of the epithelial marker pro–SP-B revealed a dramatic decrease in expression with ET-1 treatment relative to control. BQ-123 prevented this decrease, while BQ-788 did not. Densitometric analysis (right panel) represents three separate experiments. *P < 0.05 compared with control and ET-1 + BQ-123.
<b>Figure 4.</b>
Figure 4.
ET-1 increases total TGF-β1 production from primary AEC and induces Smad3 phosphorylation through ET-A. (A) ELISA was used to quantify total TGF-β1 in the supernatant of AEC treated with and without ET-1. ET-1 increased TGF-β1 production by AEC. BQ-123, an ET-A receptor antagonist, prevented the ET-1–induced increase in TGF-β1 production. BQ-788, an ET-B receptor antagonist, had no effect on TGF-β1 secretion. (B) Immunoblot analysis demonstrated an increase in phosphorylated Smad3 (p-Smad3) by ET-1 after 24 h of treatment. BQ-123 abrogated this effect, and BQ-788 had no effect. Bar graphs represent mean ± SEM (n = 4). *P < 0.05 versus control (no treatment) and ET-1 + BQ-123.
<b>Figure 5.</b>
Figure 5.
The induction of EMT by ET-1 is mediated by TGF-β1. (A) Immunoblot analysis of AEC for α-SMA expression revealed ET-1 increased α-SMA expression relative to control. However, the addition of an anti–TGF-β1 monoclonal antibody (anti–TGF-β1 mAb) dramatically attenuated the effect of ET-1. GAPDH was used as a loading control. Immunoblots shown are representative of three independent studies. Densitometric values are mean ± SEM. *P < 0.05 compared with control and ET-1 + Anti–TGF-β1 mAb. (B) Immunofluorescence analysis similarly demonstrated that ET-1 increases α-SMA expression, and that the increase is inhibited by anti–TGF-β1 mAb. Green staining represents α-SMA, while blue staining represents nuclei stained with DAPI.
<b>Figure 6.</b>
Figure 6.
ET-1 receptors do not mediate alveolar EMT induced by exogenous TGF-β1. (A) Immunoblot analysis of AEC for α-SMA expression revealed that TGF-β1 (1 ng/ml) increased α-SMA expression dramatically relative to control. The addition of an ET-A (BQ-123) or ET-B (BQ-788) receptor antagonist had no effect on the increase in α-SMA expression. GAPDH was used as a loading control. Immunoblots shown are representative of five independent studies. Densitometric values are mean ± SEM. *P < 0.05 compared with control. (B) Immunofluorescence analysis similarly demonstrated that ET-1 receptor antagonism did not affect the TGF-β1–induced increase in α-SMA expression, or the change in cell morphology to a fibroblast-like shape. Green staining represents α-SMA, while blue staining represents nuclei stained with DAPI.

Comment in

Similar articles

Cited by

References

    1. Yanagisawa M, Kurihara H, Kimura S, Tomobe Y, Kobayashi M, Mitsui Y, Yazaki Y, Goto K, Masaki T. A novel potent vasoconstrictor peptide produced by vascular endothelial cells. Nature 1988;332:411–415. - PubMed
    1. Fagan KA, McMurtry IF, Rodman DM. Role of endothelin-1 in lung disease. Respir Res 2001;2:90–101. - PMC - PubMed
    1. Kadono T, Kikuchi K, Sato S, Soma Y, Tamaki K, Takehara K. Elevated plasma endothelin levels in systemic sclerosis. Arch Dermatol Res 1995;287:439–442. - PubMed
    1. Cambrey AD, Harrison NK, Dawes KE, Southcott AM, Black CM, du Bois RM, Laurent GJ, McAnulty RJ. Increased levels of endothelin-1 in bronchoalveolar lavage fluid from patients with systemic sclerosis contribute to fibroblast mitogenic activity in vitro. Am J Respir Cell Mol Biol 1994;11:439–445. - PubMed
    1. Uguccioni M, Pulsatelli L, Grigolo B, Facchini A, Fasano L, Cinti C, Fabbri M, Gasbarrini G, Meliconi R. Endothelin-1 in idiopathic pulmonary fibrosis. J Clin Pathol 1995;48:330–334. - PMC - PubMed

Publication types