Comparative Study
. 2007 Apr 18;26(8):2041-51.
doi: 10.1038/sj.emboj.7601654. Epub 2007 Mar 22.

Long-range chromosomal interactions regulate the timing of the transition between poised and active gene expression

Affiliations
Comparative Study

Long-range chromosomal interactions regulate the timing of the transition between poised and active gene expression

Douglas Vernimmen et al. EMBO J. .

Abstract

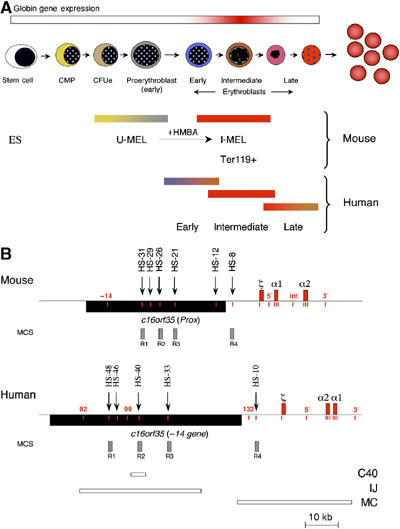
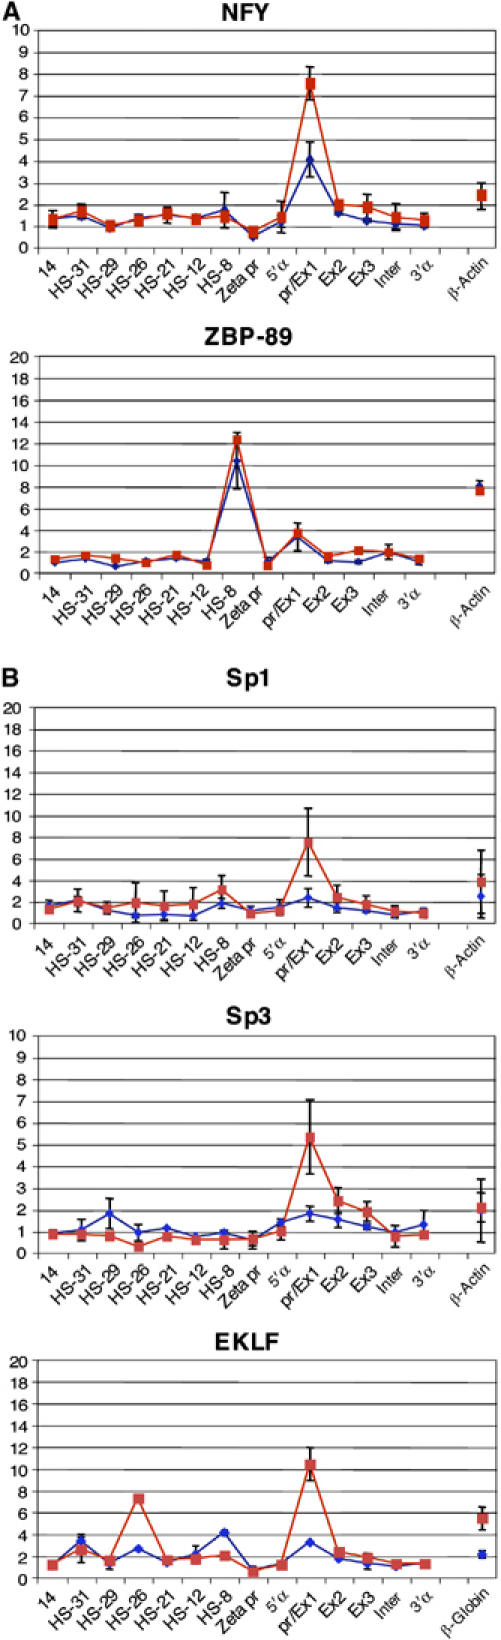
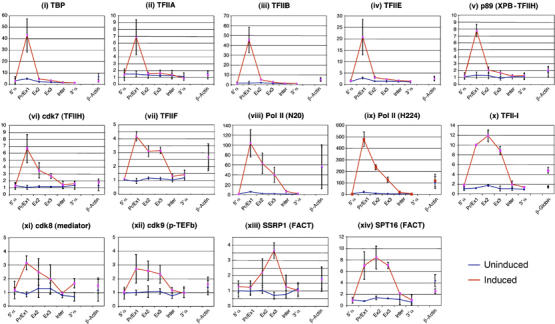
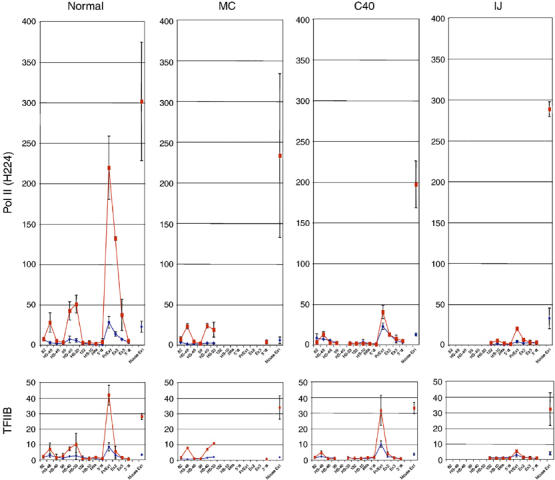
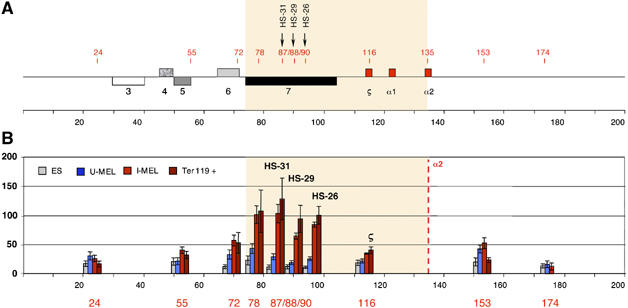
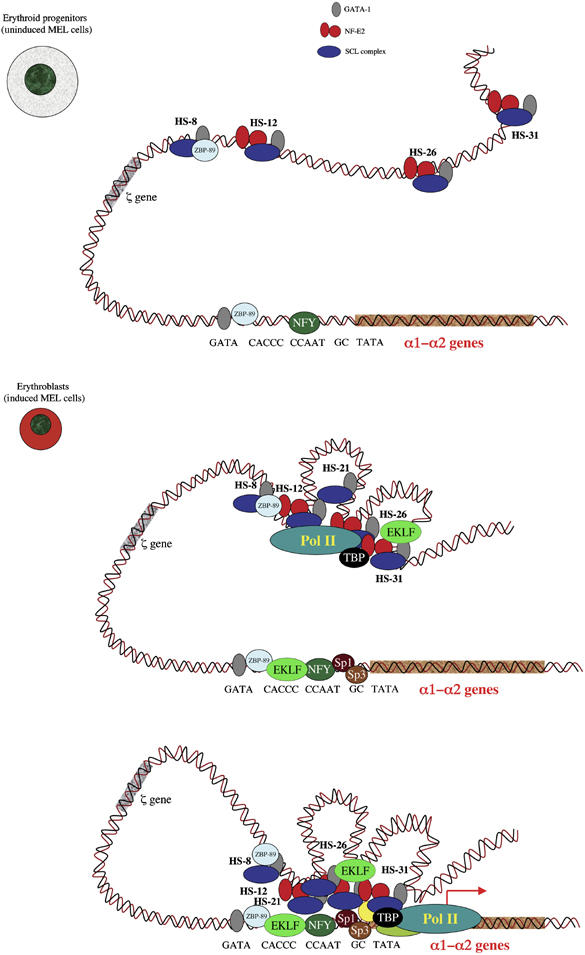
To understand how mammalian genes are regulated from their natural chromosomal environment, we have analysed the molecular events occurring throughout a 150 kb chromatin segment containing the alpha globin gene locus as it changes from a poised, silent state in erythroid progenitors, to the fully activated state in late, erythroid cells. Active transcription requires the late recruitment of general transcription factors, mediator and Pol II not only to the promoter but also to its remote regulatory elements. Natural mutants of the alpha cluster show that whereas recruitment of the pre-initiation complex to the upstream elements occurs independently, recruitment to the promoter is largely dependent on the regulatory elements. An improved, quantitative chromosome conformation capture analysis demonstrates that this recruitment is associated with a conformational change, in vivo, apposing the promoter with its remote regulators, consistent with a chromosome looping mechanism. These findings point to a general mechanism by which a gene can be held in a poised state until the appropriate stage for expression, coordinating the level and timing of gene expression during terminal differentiation.


Figures

Figure 1
Figure 1
An outline of erythropoiesis, the cell lines used and schematics of the human and mouse α globin gene clusters. (A) The stages of differentiation as primary haematopoietic stem cells differentiate to mature erythrocytes and the corresponding cell lines used in this study. As a source of pluripotent mouse cells, we used embryonic stem cells (ES). Mouse erythroleukaemia (MEL) cells are well characterised, transformed erythroid cells that are blocked at the CFUe or early proerythroblast stage of differentiation (U-MEL). Induction of MEL cells by HMBA (hexa-methylene bis-acetamide) gives rise to terminally differentiated but still nucleated erythroid cells that express α and β globin mRNA at high levels (I-MEL). Primary mouse erythroblasts (Ter119+) were isolated from the spleens of phenylhydrazine-treated mice. Primary human erythroblasts at different stages of differentiation (early, intermediate and late) were isolated as previously described (Brown et al, 2006). Abreviations used: ES: embryonic stem cells; CMP: common myeloid progenitors; CFUe: colony forming units-erythroid; U-MEL: uninduced mouse erythroleukaemia cells ; I-MEL : induced MEL cells. (B) Chromosomal organisation of the mouse (top) and human (below) α globin clusters. The globin genes are shown as labelled red boxes. The positions of previously described DNase1 hypersensitive sites, discussed in the text, are shown as arrows. The widely expressed gene, c16orf35 (also known as −14 gene in human or the Prox gene in mouse), transcribed from the opposite strand to that of α globin is shown as a black box. Short vertical lines (red) indicate amplicons analysed in ChIP experiments. Grey boxes refer to previously defined multi-species conserved elements (MCS). Previously described deletions from the human α globin cluster (Bernet et al, 1995; Craddock et al, 1995) are shown as annotated (C40, IJ and MC) boxes.
Figure 2
Figure 2
Recruitment of NFY and ZBP-89 (A) and Sp/X-Kruppel-like transcription factors (B) at the mouse α globin core promoter. Real-time PCR analysis of immunoprecipitated chromatin using the antibodies indicated in uninduced (blue) and induced (red) MEL cells. The y-axis represents enrichment over the input DNA, normalised to a control sequence in the GAPDH gene. The x-axis represents the positions of Taqman probes used. The coding sequence is represented by the three exons (promoter/Ex1, Ex2 and Ex3) of the α globin genes. Inter refers to the intergenic region (between α1 and α2). Negative controls 5′α and 3′α flank the α globin gene. β-Actin and β globin denote control sequences at the mouse β-actin gene and β globin promoter, respectively. Error bars correspond to ±1 s.d. from at least two independent ChIPs. Similar data were obtained from primary cells (Supplementary Figure S2).
Figure 3
Figure 3
Recruitment of the pre-initiation complex at the mouse α globin core promoter during erythroid maturation. Real-time PCR analysis of immunoprecipitated chromatin using the antibodies indicated in uninduced (blue) and induced (red) MEL cells as in Figure 2. Error bars correspond to ±1 s.d. from at least two independent ChIPs. GTFs involved in recruitment of Pol II and initiation of transcription (TBP, TFIIA, TFIIB, TFIIE and TFIIH) were found at the promoter of the α globin gene only at the late stages (I-MEL) of terminal erythroid differentiation. We and others have found that the degree of enrichment observed for different transcription factors is not directly comparable. For example TFIIA (enriched 6 × ) and Pol II (enriched 100 × ) are both components of the same multiprotein complex. These differences may be caused by different epitope affinities or by differences in the degree of crosslinking for different components of such complexes.
Figure 4
Figure 4
Binding of the pre-initiation complex at the upstream elements and the human α globin promoter. ChIP analyses using uninduced (blue) and induced (red) interspecific MEL hybrids containing a normal copy of chromosome 16 or copies of chromosome 16 from which HS-40 alone (C40; Figure 1B) or a larger segment (MC and IJ; Figure 1B) is deleted. Mouse Ex1 is an internal control corresponding to the mouse α globin promoter. The y-axis represents levels of enrichment of Pol II (top) and TFIIB (bottom) in mouse × human 16 hybrids. The x-axis represents the position of Taqman probes used across the human α globin locus, with the positions of erythroid-specific DNaseI hypersensitive sites. Error bars correspond to ±1 s.d. from two independent ChIPs.
Figure 5
Figure 5
Intrachromosomal interactions involving mouse remote regulatory sequences and the mouse α2 globin promoter. (A) Chromosomal organisation of the mouse α globin locus. The following genes are annotated: 3, IL9RP3; 4, m-99; 5, Dist; 6, MPG; 7, c16orf35 gene. These are shown as boxes transcribed from the top (above the line) or bottom (below the line) DNA strand. Red numbers indicate the points (coordinates) analysed by 3C. 3C assays were performed using HindIII-digested, fixed chromatin from ES, uninduced MEL (U-MEL), induced MEL (I-MEL) and primary erythroblasts (Ter119+). The shaded area corresponds to the region containing all sequences that interact with the α globin gene (B). The bar chart (y-axis) shows the enrichment of PCR product (%) normalised to the enrichment within the Ercc3 gene (=100%). This provides an internal, genomic control for the crosslinking procedure and any general changes in nuclear or chromatin structure (de Laat and Grosveld, 2003). This, in turn, is a measure of the association between the points indicated to a fixed point (the mouse α2 globin promoter) in cells representing different stages of differentiation, from embryonic stem cells (ES) to mature erythroblasts (I-MEL and primary Ter119+ cells). We have not considered the α1 gene in this study because the HindIII fragment containing this gene is too large (14 kb) for appropriate 3C analysis. Data shown represent the average of at least two independent experiments using Taqman/real-time PCR. Error bars denote s.e.m. Each PCR was performed several times and averaged. Signals were normalised to the total amount of DNA used, estimated with an amplicon located within a HindIII fragment. Coordinates of the points analysed are indicated on the x-axis. As an illustration of the specificity of these interactions, the interaction between α globin and HS-26 (∼40 kb apart) is enriched in erythroid cells, whereas the interaction between α globin and a region at +174 (∼40 kb in the opposite direction) is not enriched.
Figure 6
Figure 6
A model proposing how complexes form and interact at the mouse α globin locus during erythropoiesis. In committed erythroid progenitors (U-MEL, proerythroblast stage), the remote regulatory sequences (HS-31, HS-26, HS-12 and HS-8) are bound by multiprotein complexes containing various combinations of SCL, NF-E2 and GATA1. At this stage, the α globin promoter is also occupied by GATA1 in combination with the ubiquitous transcription factors ZBP-89 and NFY and is best poised for expression. In differentiating erythroid cells (I-MEL and primary erythroblasts), the PIC, including Pol II, is recruited to the enhancers in a cooperative manner, but independently of the promoter. Sp/X-Kruppel-like transcription factors (e.g. Sp1 and Sp3) are also recruited independently of the upstream elements, to the promoter. At this final stage, the α globin promoter is now occupied by a multiprotein complex including GATA1, ZBP-89, EKLF, NFY, Sp1 and Sp3 that represents a docking site for the recruitment of PIC, which is entirely dependent on the presence of the upstream elements.

References

    1. Anguita E, Hughes J, Heyworth C, Blobel GA, Wood WG, Higgs DR (2004) Globin gene activation during haemopoiesis is driven by protein complexes nucleated by GATA-1 and GATA-2. EMBO J 23: 2841–2852 - PMC - PubMed
    1. Anguita E, Johnson CA, Wood WG, Turner BM, Higgs DR (2001) Identification of a conserved erythroid specific domain of histone acetylation across the alpha-globin gene cluster. Proc Natl Acad Sci USA 98: 12114–12119 - PMC - PubMed
    1. Ashe HL, Monks J, Wijgerde M, Fraser P, Proudfoot NJ (1997) Intergenic transcription and transinduction of the human beta-globin locus. Genes Dev 11: 2494–2509 - PMC - PubMed
    1. Bartlett J, Blagojevic J, Carter D, Eskiw C, Fromaget M, Job C, Shamsher M, Trindade IF, Xu M, Cook PR (2006) Specialized transcription factories. Biochem Soc Symp 73: 67–75 - PubMed
    1. Bender MA, Mehaffey MG, Telling A, Hug B, Ley TJ, Groudine M, Fiering S (2000) Independent formation of DnaseI hypersensitive sites in the murine beta-globin locus control region. Blood 95: 3600–3604 - PubMed

Publication types