. 2007 Apr;117(4):931-43.
doi: 10.1172/JCI29031. Epub 2007 Mar 22.

Autistic-like phenotypes in Cadps2-knockout mice and aberrant CADPS2 splicing in autistic patients

Affiliations

Autistic-like phenotypes in Cadps2-knockout mice and aberrant CADPS2 splicing in autistic patients

Tetsushi Sadakata et al. J Clin Invest. 2007 Apr.

Abstract

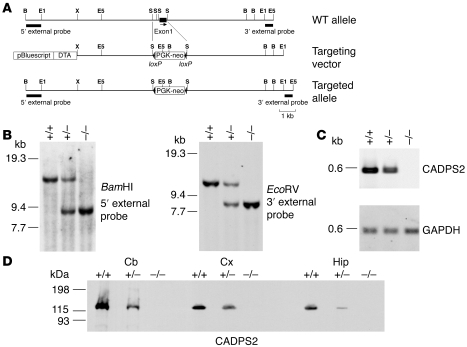
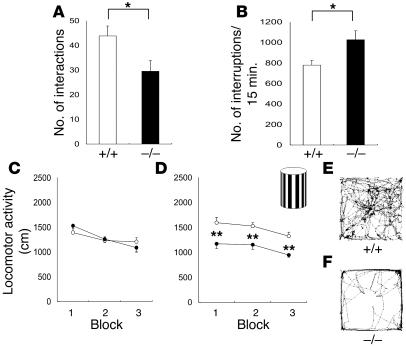
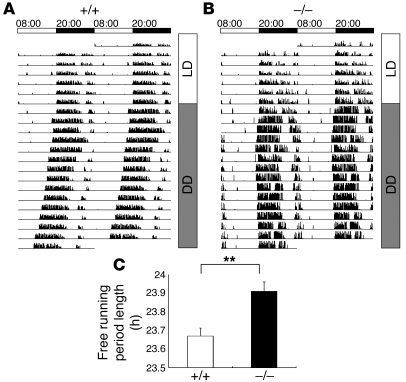
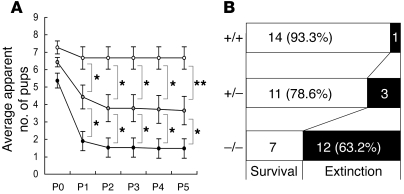
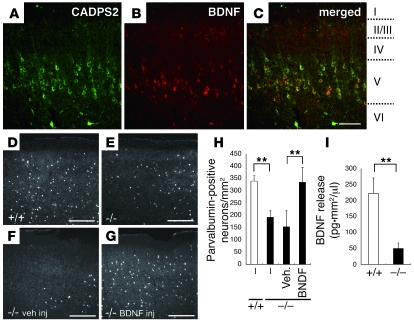
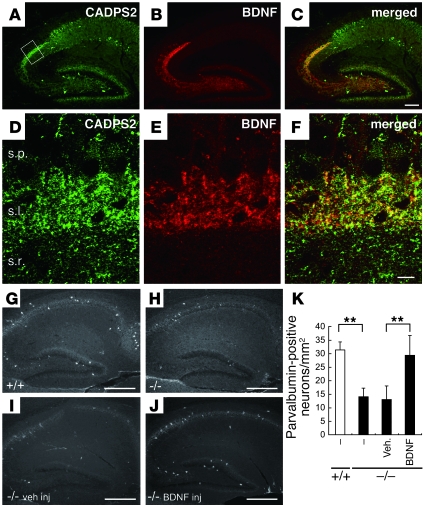
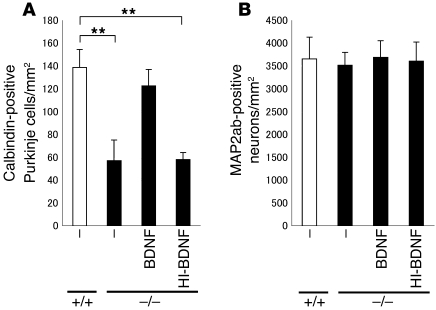
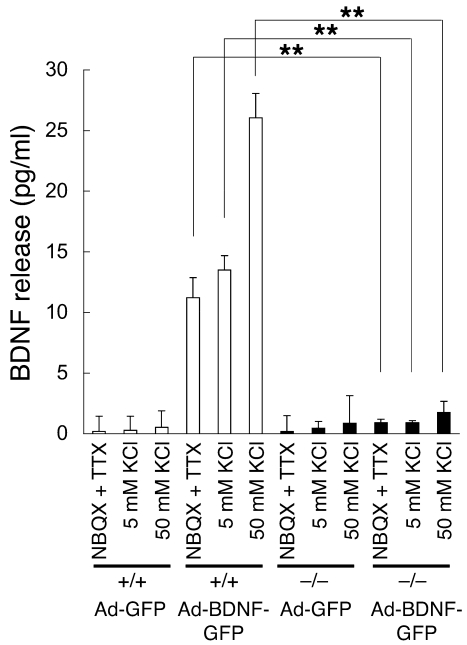
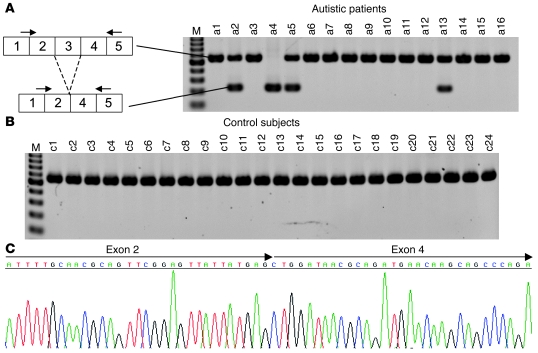
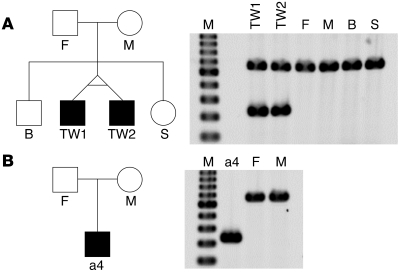
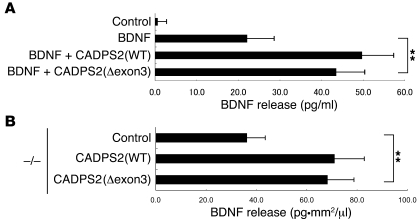
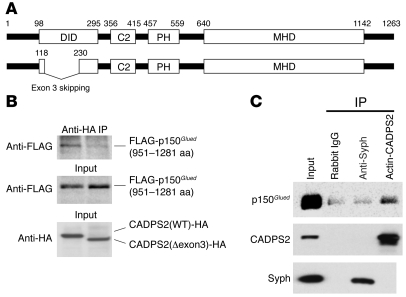
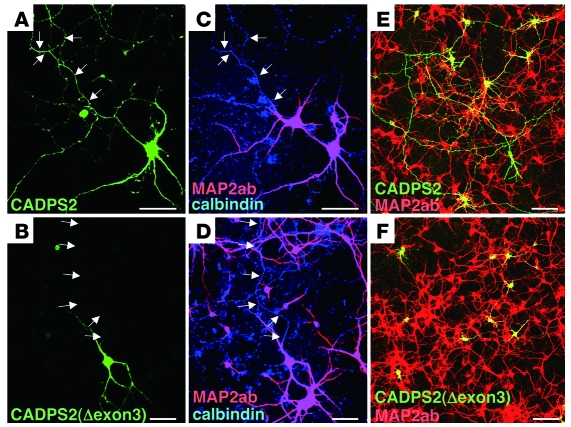
Autism, characterized by profound impairment in social interactions and communicative skills, is the most common neurodevelopmental disorder, and its underlying molecular mechanisms remain unknown. Ca(2+)-dependent activator protein for secretion 2 (CADPS2; also known as CAPS2) mediates the exocytosis of dense-core vesicles, and the human CADPS2 is located within the autism susceptibility locus 1 on chromosome 7q. Here we show that Cadps2-knockout mice not only have impaired brain-derived neurotrophic factor release but also show autistic-like cellular and behavioral phenotypes. Moreover, we found an aberrant alternatively spliced CADPS2 mRNA that lacks exon 3 in some autistic patients. Exon 3 was shown to encode the dynactin 1-binding domain and affect axonal CADPS2 protein distribution. Our results suggest that a disturbance in CADPS2-mediated neurotrophin release contributes to autism susceptibility.


Figures

Figure 1
Figure 1. Generation of Cadps2–/– mice.
(A) Maps of the Cadps2 gene, the targeting vector, and the resultant targeted allele are shown. Probes for Southern blot analysis to screen for targeted ES clones are indicated by small solid bars. Restriction enzyme sites include the following: B, BamHI; E1, EcoRI; E5, EcoRV; S, SmaI; X, XhoI. DTA, diphtheria toxin A fragment (B) Southern blot analysis, using the probes indicated in A, of DNA from tails of a single litter derived from a cross between heterozygotes. +/+, WT mice; +/–, heterozygous mice; –/–, homozygous mice. (C) RT-PCR banding patterns of CADPS2 using brain total RNA of P21 WT, heterozygous, and homozygous mice. The GAPDH gene was used as a constantly expressed control mRNA. (D) Immunoblot analysis of the cerebellum, neocortex, and hippocampus of P8 WT, heterozygous, and homozygous mice. Protein lysates from these brain regions were immunoblotted with anti-CADPS2 antibody. Cb, cerebellum; Cx, neocortex; Hip, hippocampus.
Figure 2
Figure 2. Autistic-like behavior of Cadps2–/– mice.
(A) Number of reciprocal interactions of Cadps2–/– mouse pairs (black bar; n = 12) and of WT littermate pairs (white bar; n = 12) for 20 minutes. (B) Locomotor activity in home cages. After habituation to a fresh cage for 24 hours, the locomotor activity of Cadps2–/– mice (black bar; n = 9) and WT littermates (white bar; n = 9) was measured for 6 days (12-hour LD cycle [LD]). The number of photobeam interruptions per 15 minutes is shown in the y axis. (CF) Horizontal locomotor activity of Cadps2–/– mice (filled circles; n = 15) and of WT littermates (open circles; n = 17) in an open field is shown in 3 blocks (5 minutes each) in the absence (C) or presence (D) of the novel object shown in the upper right of D. Representative movement traces of WT and Cadps2–/– are shown in E and F, respectively. Error bars indicate the SEM. *P < 0.05; **P < 0.01, by Student’s t test.
Figure 3
Figure 3. An abnormal sleep/wake rhythm of Cadps2–/– mice.
(A and B) Sleep/wake rhythms of locomotor activity under free wheel-running conditions. Representative activity traces of WT (A) and Cadps2–/– (B) mice for 7 days of LD cycle and 14 days of constant darkness (DD) are represented as relative deflections from the horizontal line. Actograms are double-plotted over a 48-hour period. Time is expressed in a 24-hour cycle on the top of A and B. (C) The circadian period (h) calculated by a c2 periodogram of Cadps2–/– mice (black bar; n = 9) and WT littermates (open bar; n = 8). The error bars indicate the SEM. **P < 0.01, Student’s t test.
Figure 4
Figure 4. Maternal neglect of newborns by Cadps2–/– mothers.
(A) Survival of pups born to virgin Cadps2–/– (closed circles; n = 19 mothers), Cadps2+/– (gray circles; n = 14 mothers), and WT (open circles; n = 15 mothers) females mated with WT males. Shown is mean ± SEM. *P < 0.05; **P < 0.01, Mann-Whitney U test. (B) Number of cages that contained live pups (white bars) versus number of pup extinction cages (black bars) 2 days after birth.
Figure 5
Figure 5. Abnormal immunohistochemical findings in the Cadps2–/– mouse neocortex.
(AC) Sagittal sections of the P8 motor cortex immunostained for CADPS2 (green in A) and BDNF (red in B). A merged image is shown in C. I, II/III, IV, V, and VI represent cortical layers. Scale bars: 100 μm. (DG) Sagittal sections of WT (D) and Cadps2–/– (EG) P17 motor cortex immunostained for parvalbumin. (F and G) Sections were prepared from P17 Cadps2–/– mice 12 days after an icv injection of either vehicle (veh inj) (F) or BDNF (BDNF inj) (G). Scale bars: 200 μm. (H) Cell density of parvalbumin-positive neurons in the P17 motor cortex. The error bars indicate SD. (I) BDNF release activity in WT (white bars) and Cadps2–/– (black bars) neocortical cultures was evaluated at 21 DIV by measuring the amounts of BDNF spontaneously secreted into the culture medium over the course of 21 days. Activity is indicated in BDNF concentration (pg/μl) normalized to cell density (/mm2). Average values obtained from 6 independent experiments are shown. The error bars indicate SD. **P < 0.01, Student’s t test.
Figure 6
Figure 6. Abnormal immunohistochemical findings in the Cadps2–/– mouse hippocampus.
(AC) Sagittal sections of the P8 hippocampus immunostained for CADPS2 (green in A) and BDNF (red in B). A merged image is shown in C. Scale bar: 200 μm. (DF) Higher magnification of the region shown by the square in A. s.p., stratum pyramidale; s.l., stratum lucidum; s.r., stratum radiatum. Scale bar: 10 μm. (GJ) Sagittal sections of WT (G) and Cadps2–/– (HJ) P17 hippocampus immunostained for parvalbumin. (I and J) Sections were prepared from P17 Cadps2–/– mice 12 days after an icv injection of either vehicle (I) or BDNF (J). Scale bars: 500 μm. (K) Cell density of parvalbumin-positive neurons in the P17 hippocampus. The error bars indicate SD. **P < 0.01, Student’s t test.
Figure 7
Figure 7. Increased cell death of Cadps2–/– Purkinje cells.
(A and B) Cell density of calbindin-positive (A) and MAP2ab-positive (B) neurons in primary dissociated cultures (8 DIV) of WT (white bars) and Cadps2–/– (black bars) cerebella. Cerebellar cultures were grown in the absence or presence of the BDNF (10 ng/ml). Heat-inactivated BDNF (HI-BDNF; 10 ng/ml; 100°C, 15 minutes) was also used. The medium was changed at 4 DIV with readdition of BDNF or HI-BDNF. The error bars indicate SD. **P < 0.01, Student’s t test.
Figure 8
Figure 8. Decreased release of BDNF from Cadps2–/– cerebellar cultures.
WT (white bars) and Cadps2–/– (black bars) cerebellar cultures were infected with the Ad-GFP and Ad-BDNF-GFP at 5 DIV. ELISA of BDNF levels released into the conditioned media from the cultures at 7 DIV with NBQX plus TTX, 5 mM KCl, and 50 mM KCl stimulation for 15 minutes. Average values obtained from 3 independent experiments are shown. There was no significant difference in MAP2ab-positive cell density and cellular BDNF contents between the WT and Cadps2–/– cultures infected with Ad-BDNF-GFP (data not shown). The error bars indicate SD. **P < 0.01, Student’s t test.
Figure 9
Figure 9. Aberrant CADPS2 splicing in autistic patients.
(A and B) RT-PCR analysis of CADPS2 mRNA in blood from autistic patients (a1–a16) (A) and healthy control subjects (c1–c24) (B). A single major band (661 bp) is apparent in the control individuals. An additional band (381 bp) that resulted from skipping of exon 3 was detected in patients a2, a4, a5, and a13. The primers used are indicated on the corresponding exons by arrows. M, 100-bp ladder molecular size marker (from 200 bp at the bottom to 1000 bp at the top). (C) Sequencing pattern of the aberrant RT-PCR product from patient a4. The arrows indicate exon 2–exon 4 in the frame without exon 3. The same results were obtained in 3 other patients (a2, a5, and a13).
Figure 10
Figure 10. Expression of exon 3–skipped CADPS2 mRNA in 2 pedigrees that include autistic patients.
(A and B) Pedigree structures (left) and patterns of agarose gel electrophoresis on the RT-PCR analysis of CADPS2 mRNA expressed in the blood of each individual (right). (A) Male monozygotic autistic twins (TW1 [autistic patient a5 shown in Figure 9A] and TW2 [autistic patient]) and their family members. A single major band (661 bp) produced by normal alternative splicing is apparent in their father (F); mother (M); older brother (B); and younger sister (S). On the other hand, an additional, 381-bp band produced by exon 3–skipped alternative splicing was expressed in both monozygotic autistic twins. (B) The autistic patient (patient a4 shown in Figure 9A), who expressed only the exon 3–skipped shorter band, and the patient’s family members. Similar to the family members in A, a single major band of 661 bp is expressed in the father and mother. M, molecular weight marker of the 100-bp ladder (from 200 bp at the bottom to 1000 bp at the top).
Figure 11
Figure 11. Functional analyses of CADPS2 exon 3.
(A) BDNF release induced by 50 mM KCl in PC12 cells transfected with CADPS2(WT) or CADPS2(Δexon3) together with a BDNF expression plasmid. Average values obtained from 4 independent experiments are shown. (B) BDNF release activity in Cadps2–/– neocortical cultures transfected with control vector, CADPS2(WT), or CADPS2(Δexon3) using the calcium phosphate method at 4 DIV was evaluated at 21 DIV by measuring the amounts of BDNF spontaneously secreted into the culture medium over the course of the previous 17 days. Activity is indicated in BDNF concentration (pg/μl) normalized to cell density (/mm2). Average values obtained from 4 independent experiments are shown. The error bars indicate SD. **P < 0.01, Student’s t test.
Figure 12
Figure 12. Interacting protein of CADPS2 exon 3.
(A) Schematic depiction of human CADPS2 protein (GenBank accession number NP_060424). The C2- and pleckstrin homology (PH)-like domain, Munc13-1–homologous domain (MHD), and p150Glued (also known as dynactin 1) -interacting domain (DID) used as bait are shown. Exon 3 skipping leads to a deletion of 111 aa residues (from 119 to 229). (B) Coimmunoprecipitation experiments using lysates of COS-7 cells coexpressing p150Glued 951–1281 residues and CADPS2 constructs tagged with N-terminal FLAG and C-terminal HA epitopes, respectively. Coimmunoprecipitates with anti-HA antibody to CADPS2 constructs were blotted with anti-FLAG antibody (upper panel). Input lysates were blotted with anti-FLAG antibody (middle panel) and anti-HA antibody (lower panel). (C) The endogenous p150Glued was coimmunoprecipitated with the endogenous CADPS2 in P8 mouse neocortex extracts but not with endogenous synaptophysin (Syph). The blots were immunostained for p150Glued (upper panel), CADPS2 (middle panel), and synaptophysin (lower panel).
Figure 13
Figure 13. Aberrant distribution patterns of exon 3–skipped CADPS2 protein.
(AD) Subcellular localization of C-terminal HA-tagged CADPS2(WT) (A) and CADPS2(Δexon3) protein (B) exogenously expressed in neocortical primary cultures immunostained for HA (green), MAP2ab (red), and calbindin (blue) at 14 DIV. Arrows show the position of MAP2ab-negative and calbindin-positive axons as shown in the same frame (C and D). (E and F) Subcellular localization of C-terminal HA-tagged CADPS2(WT) (E) and CADPS2(Δexon3) (F) protein exogenously expressed in cerebellar primary cultures immunostained for HA (green) and MAP2ab (red) at 7 DIV. Scale bars: 50 μm.

Comment in

Similar articles

Cited by

References

    1. World Health Organization. 1992. The ICD-10 classification of mental and behavioural disorders: clinical descriptions and diagnostic guidelines. World Health Organization. Geneva, Switzerland. http://www.who.int/substance_abuse/terminology/icd_10/en/index.html.
    1. American Psychiatric Association. 1994. Diagnostic and statistical manual of mental disorders: DSM-IV. American Psychiatric Publishing Inc. Washington, DC, USA. 886 pp.
    1. Muhle R., Trentacoste S.V., Rapin I. The genetics of autism. Pediatrics. 2004;113:e472–e486. - PubMed
    1. Folstein S.E., Rosen-Sheidley B. Genetics of autism: complex aetiology for a heterogeneous disorder. Nat. Rev. Genet. 2001;2:943–955. - PubMed
    1. Jamain S., et al. Mutations of the X-linked genes encoding neuroligins NLGN3 and NLGN4 are associated with autism. Nat. Genet. 2003;34:27–29. - PMC - PubMed

Publication types

MeSH terms

Substances