

Discovering motifs in ranked lists of DNA sequences
- PMID: 17381235
- PMCID: PMC1829477
- DOI: 10.1371/journal.pcbi.0030039
Discovering motifs in ranked lists of DNA sequences
Abstract
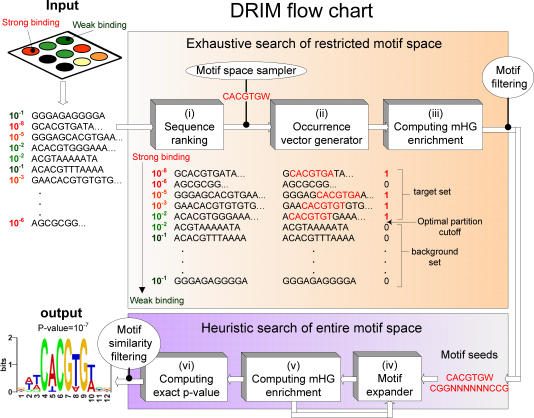
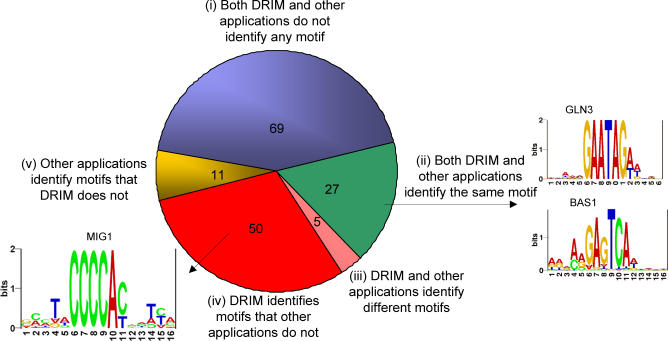
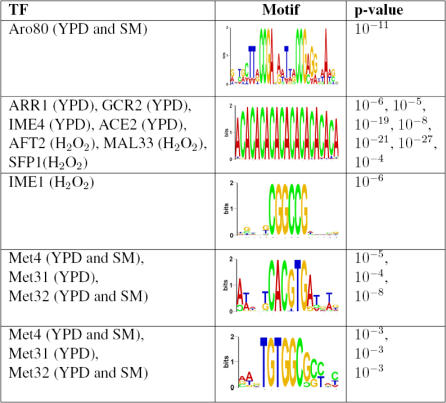
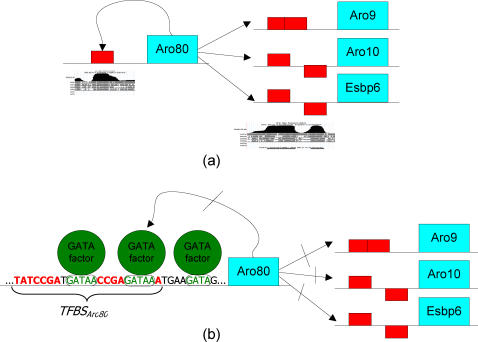
Computational methods for discovery of sequence elements that are enriched in a target set compared with a background set are fundamental in molecular biology research. One example is the discovery of transcription factor binding motifs that are inferred from ChIP-chip (chromatin immuno-precipitation on a microarray) measurements. Several major challenges in sequence motif discovery still require consideration: (i) the need for a principled approach to partitioning the data into target and background sets; (ii) the lack of rigorous models and of an exact p-value for measuring motif enrichment; (iii) the need for an appropriate framework for accounting for motif multiplicity; (iv) the tendency, in many of the existing methods, to report presumably significant motifs even when applied to randomly generated data. In this paper we present a statistical framework for discovering enriched sequence elements in ranked lists that resolves these four issues. We demonstrate the implementation of this framework in a software application, termed DRIM (discovery of rank imbalanced motifs), which identifies sequence motifs in lists of ranked DNA sequences. We applied DRIM to ChIP-chip and CpG methylation data and obtained the following results. (i) Identification of 50 novel putative transcription factor (TF) binding sites in yeast ChIP-chip data. The biological function of some of them was further investigated to gain new insights on transcription regulation networks in yeast. For example, our discoveries enable the elucidation of the network of the TF ARO80. Another finding concerns a systematic TF binding enhancement to sequences containing CA repeats. (ii) Discovery of novel motifs in human cancer CpG methylation data. Remarkably, most of these motifs are similar to DNA sequence elements bound by the Polycomb complex that promotes histone methylation. Our findings thus support a model in which histone methylation and CpG methylation are mechanistically linked. Overall, we demonstrate that the statistical framework embodied in the DRIM software tool is highly effective for identifying regulatory sequence elements in a variety of applications ranging from expression and ChIP-chip to CpG methylation data. DRIM is publicly available at http://bioinfo.cs.technion.ac.il/drim.
Conflict of interest statement
Figures
Similar articles
-
De novo prediction of cis-regulatory elements and modules through integrative analysis of a large number of ChIP datasets.BMC Genomics. 2014 Dec 2;15:1047. doi: 10.1186/1471-2164-15-1047. BMC Genomics. 2014. PMID: 25442502 Free PMC article.
-
Localized motif discovery in gene regulatory sequences.Bioinformatics. 2010 May 1;26(9):1152-9. doi: 10.1093/bioinformatics/btq106. Epub 2010 Mar 11. Bioinformatics. 2010. PMID: 20223835
-
Using PhyloCon to identify conserved regulatory motifs.Curr Protoc Bioinformatics. 2007 Sep;Chapter 2:Unit 2.12. doi: 10.1002/0471250953.bi0212s19. Curr Protoc Bioinformatics. 2007. PMID: 18428790
-
DNA sequence motif: a jack of all trades for ChIP-Seq data.Adv Protein Chem Struct Biol. 2013;91:135-71. doi: 10.1016/B978-0-12-411637-5.00005-6. Adv Protein Chem Struct Biol. 2013. PMID: 23790213 Review.
-
An algorithmic perspective of de novo cis-regulatory motif finding based on ChIP-seq data.Brief Bioinform. 2018 Sep 28;19(5):1069-1081. doi: 10.1093/bib/bbx026. Brief Bioinform. 2018. PMID: 28334268 Review.
Cited by
-
Transcriptome sequencing supports a conservation of macrophage polarization in fish.Sci Rep. 2020 Aug 10;10(1):13470. doi: 10.1038/s41598-020-70248-y. Sci Rep. 2020. PMID: 32778701 Free PMC article.
-
Conservation of Regional Variation in Sex-Specific Sex Chromosome Regulation.Genetics. 2015 Oct;201(2):587-98. doi: 10.1534/genetics.115.179234. Epub 2015 Aug 5. Genetics. 2015. PMID: 26245831 Free PMC article.
-
pH-Gated Succinate Secretion Regulates Muscle Remodeling in Response to Exercise.Cell. 2020 Oct 1;183(1):62-75.e17. doi: 10.1016/j.cell.2020.08.039. Epub 2020 Sep 17. Cell. 2020. PMID: 32946811 Free PMC article.
-
Blood pressure regulation by CD4+ lymphocytes expressing choline acetyltransferase.Nat Biotechnol. 2016 Oct;34(10):1066-1071. doi: 10.1038/nbt.3663. Epub 2016 Sep 12. Nat Biotechnol. 2016. PMID: 27617738 Free PMC article.
-
A structural-based statistical approach suggests a cooperative activity of PUM1 and miR-410 in human 3'-untranslated regions.Silence. 2010 Sep 22;1(1):17. doi: 10.1186/1758-907X-1-17. Silence. 2010. PMID: 20860814 Free PMC article.
References
-
- Ren B, Robert F, Wyrick J, Aparicio O, Jennings E, et al. Genome-wide location and function of DNA binding proteins. Science. 2000;290:2306–2309. - PubMed
-
- Keshet I, Schlesinger Y, Farkash S, Rand E, Hecht M, et al. Evidence for an instructive mechanism of de novo methylation in cancer cells. Nat Genet. 2006;38:149–153. - PubMed
-
- Bussemaker H, Li H, Siggia E. Regulatory element detection using correlation with expression. Nat Genet. 2001;27:167–71. - PubMed
Publication types
MeSH terms
LinkOut - more resources
Full Text Sources
Other Literature Sources
Molecular Biology Databases
Miscellaneous
