

Posttranscriptional expression regulation: what determines translation rates?
- PMID: 17381238
- PMCID: PMC1829480
- DOI: 10.1371/journal.pcbi.0030057
Posttranscriptional expression regulation: what determines translation rates?
Abstract
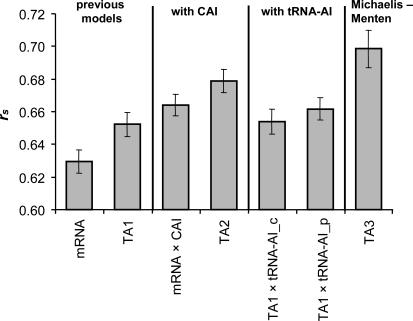
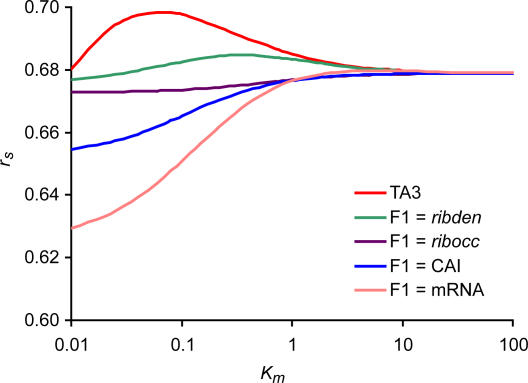
Recent analyses indicate that differences in protein concentrations are only 20%-40% attributable to variable mRNA levels, underlining the importance of posttranscriptional regulation. Generally, protein concentrations depend on the translation rate (which is proportional to the translational activity, TA) and the degradation rate. By integrating 12 publicly available large-scale datasets and additional database information of the yeast Saccharomyces cerevisiae, we systematically analyzed five factors contributing to TA: mRNA concentration, ribosome density, ribosome occupancy, the codon adaptation index, and a newly developed "tRNA adaptation index." Our analysis of the functional relationship between the TA and measured protein concentrations suggests that the TA follows Michaelis-Menten kinetics. The calculated TA, together with measured protein concentrations, allowed us to estimate degradation rates for 4,125 proteins under standard conditions. A significant correlation to recently published degradation rates supports our approach. Moreover, based on a newly developed scoring system, we identified and analyzed genes subjected to the posttranscriptional regulation mechanism, translation on demand. Next we applied these findings to publicly available data of protein and mRNA concentrations under four stress conditions. The integration of these measurements allowed us to compare the condition-specific responses at the posttranscriptional level. Our analysis of all 62 proteins that have been measured under all four conditions revealed proteins with very specific posttranscriptional stress response, in contrast to more generic responders, which were nonspecifically regulated under several conditions. The concept of specific and generic responders is known for transcriptional regulation. Here we show that it also holds true at the posttranscriptional level.
Conflict of interest statement
Figures

References
-
- Ideker T, Thorsson V, Ranish JA, Christman R, Buhler J, et al. Integrated genomic and proteomic analyses of a systematically perturbed metabolic network. Science. 2001;292:929–934. - PubMed
-
- Washburn MP, Wolters D, Yates JR., III Large-scale analysis of the yeast proteome by multidimensional protein identification technology. Nat Biotechnol. 2001;19:242–247. - PubMed
-
- Greenbaum D, Jansen R, Gerstein M. Analysis of mRNA expression and protein abundance data: An approach for the comparison of the enrichment of features in the cellular population of proteins and transcripts. Bioinformatics. 2002;18:585–596. - PubMed
Publication types
MeSH terms
Substances
LinkOut - more resources
Full Text Sources
Molecular Biology Databases
