

A high-throughput method for detection of DNA in chloroplasts using flow cytometry
- PMID: 17381841
- PMCID: PMC1847512
- DOI: 10.1186/1746-4811-3-5
A high-throughput method for detection of DNA in chloroplasts using flow cytometry
Abstract
Background: The amount of DNA in the chloroplasts of some plant species has been shown recently to decline dramatically during leaf development. A high-throughput method of DNA detection in chloroplasts is now needed in order to facilitate the further investigation of this process using large numbers of tissue samples.
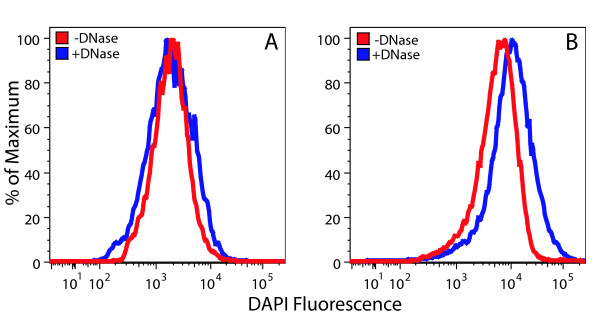
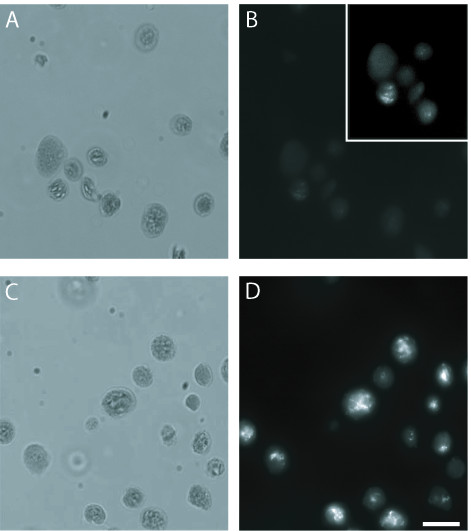
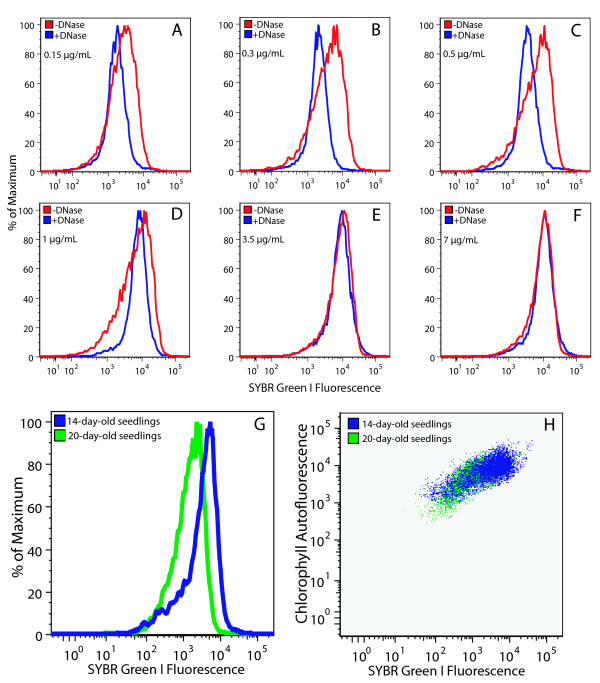
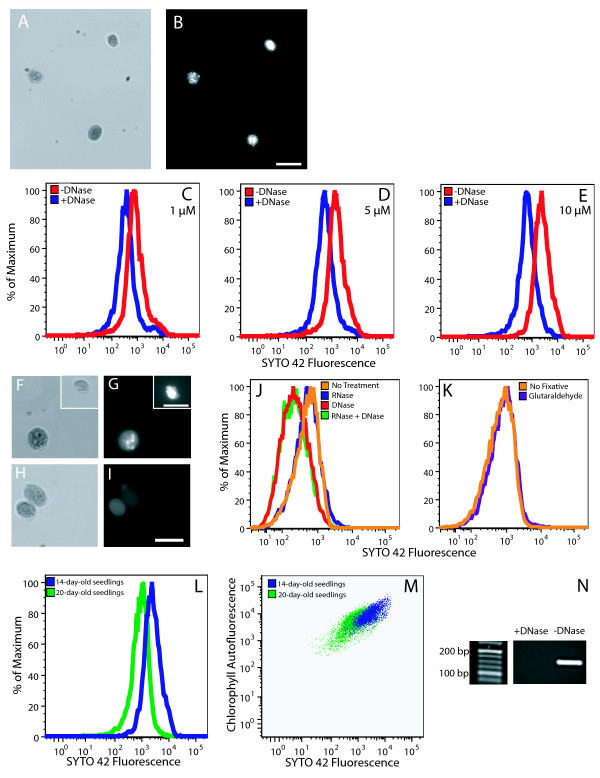
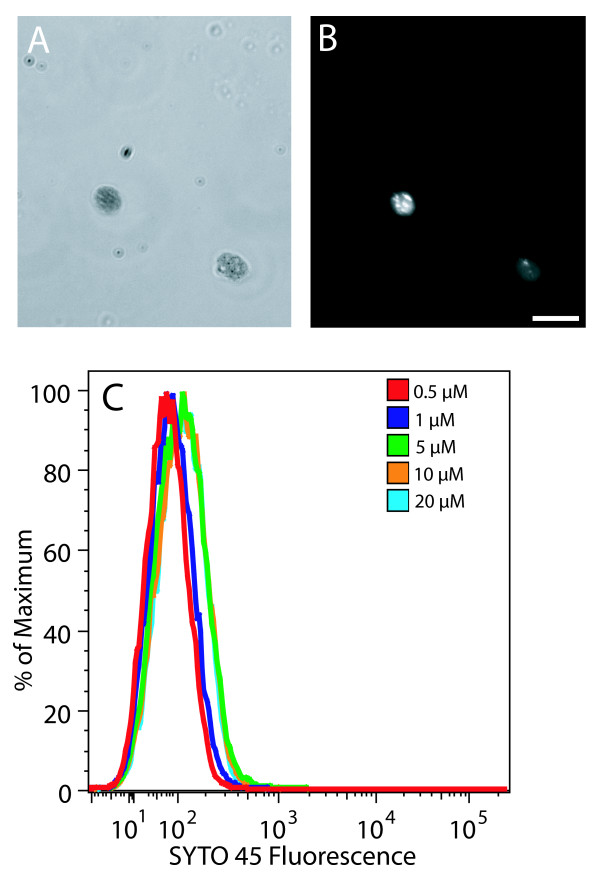
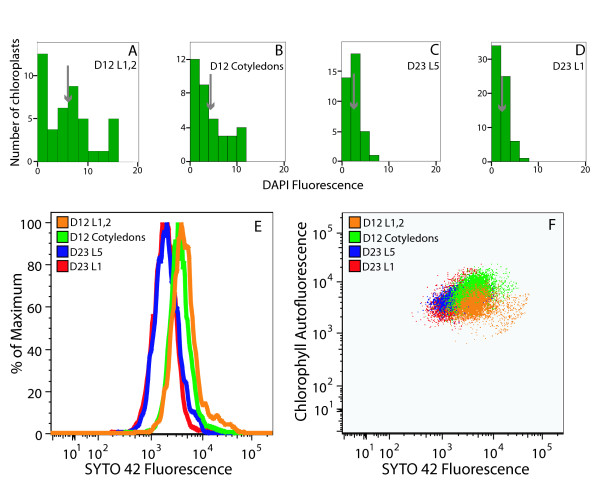
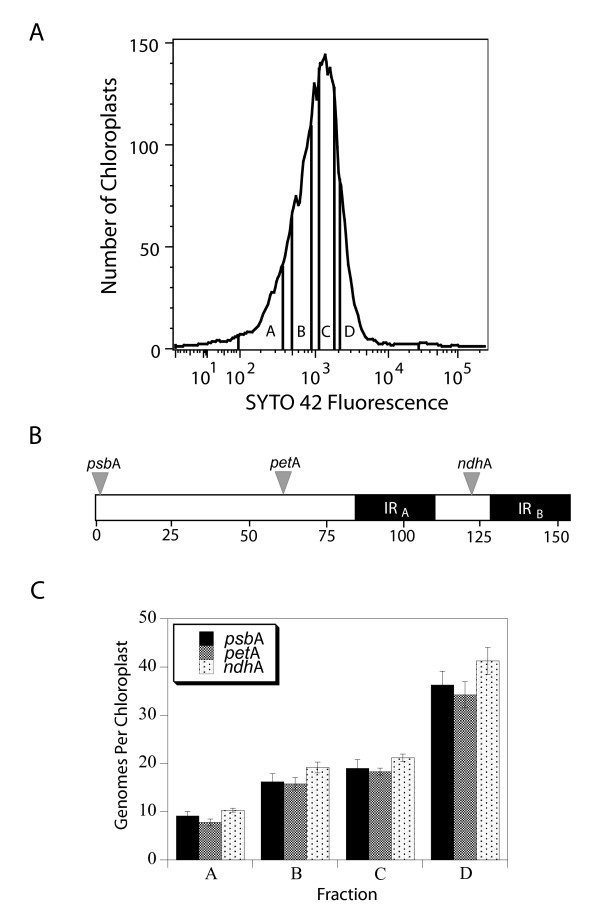
Results: The DNA-binding fluorophores 4',6-diamidino-2-phenylindole (DAPI), SYBR Green I (SG), SYTO 42, and SYTO 45 were assessed for their utility in flow cytometric analysis of DNA in Arabidopsis chloroplasts. Fluorescence microscopy and real-time quantitative PCR (qPCR) were used to validate flow cytometry data. We found neither DAPI nor SYTO 45 suitable for flow cytometric analysis of chloroplast DNA (cpDNA) content, but did find changes in cpDNA content during development by flow cytometry using SG and SYTO 42. The latter dye provided more sensitive detection, and the results were similar to those from the fluorescence microscopic analysis. Differences in SYTO 42 fluorescence were found to correlate with differences in cpDNA content as determined by qPCR using three primer sets widely spaced across the chloroplast genome, suggesting that the whole genome undergoes copy number reduction during development, rather than selective reduction/degradation of subgenomic regions.
Conclusion: Flow cytometric analysis of chloroplasts stained with SYTO 42 is a high-throughput method suitable for determining changes in cpDNA content during development and for sorting chloroplasts on the basis of DNA content.
Figures
Similar articles
-
A multiple-method approach reveals a declining amount of chloroplast DNA during development in Arabidopsis.BMC Plant Biol. 2009 Jan 7;9:3. doi: 10.1186/1471-2229-9-3. BMC Plant Biol. 2009. PMID: 19128504 Free PMC article.
-
Comparison of blue nucleic acid dyes for flow cytometric enumeration of bacteria in aquatic systems.Appl Environ Microbiol. 1998 May;64(5):1725-30. doi: 10.1128/AEM.64.5.1725-1730.1998. Appl Environ Microbiol. 1998. PMID: 9572943 Free PMC article.
-
Loss or retention of chloroplast DNA in maize seedlings is affected by both light and genotype.Planta. 2006 Dec;225(1):41-55. doi: 10.1007/s00425-006-0329-6. Epub 2006 Jun 21. Planta. 2006. PMID: 16941116
-
The loss of DNA from chloroplasts as leaves mature: fact or artefact?J Exp Bot. 2009;60(11):3005-10. doi: 10.1093/jxb/erp158. Epub 2009 May 19. J Exp Bot. 2009. PMID: 19454766 Review.
-
Chloroplast DNA Dynamics: Copy Number, Quality Control and Degradation.Plant Cell Physiol. 2018 Jun 1;59(6):1120-1127. doi: 10.1093/pcp/pcy084. Plant Cell Physiol. 2018. PMID: 29860378 Review.
Cited by
-
The structure of chloroplast DNA molecules and the effects of light on the amount of chloroplast DNA during development in Medicago truncatula.Plant Physiol. 2008 Mar;146(3):1064-74. doi: 10.1104/pp.107.112946. Epub 2008 Jan 24. Plant Physiol. 2008. PMID: 18218970 Free PMC article.
-
Selective autophagy limits cauliflower mosaic virus infection by NBR1-mediated targeting of viral capsid protein and particles.Proc Natl Acad Sci U S A. 2017 Mar 7;114(10):E2026-E2035. doi: 10.1073/pnas.1610687114. Epub 2017 Feb 21. Proc Natl Acad Sci U S A. 2017. PMID: 28223514 Free PMC article.
-
Improved Algal Toxicity Test System for Robust Omics-Driven Mode-of-Action Discovery in Chlamydomonas reinhardtii.Metabolites. 2019 May 10;9(5):94. doi: 10.3390/metabo9050094. Metabolites. 2019. PMID: 31083411 Free PMC article.
-
Differential replication of two chloroplast genome forms in heteroplasmic Chlamydomonas reinhardtii gametes contributes to alternative inheritance patterns.Genetics. 2010 Aug;185(4):1167-81. doi: 10.1534/genetics.110.118265. Epub 2010 Jun 2. Genetics. 2010. PMID: 20519744 Free PMC article.
-
RecA maintains the integrity of chloroplast DNA molecules in Arabidopsis.J Exp Bot. 2010 Jun;61(10):2575-88. doi: 10.1093/jxb/erq088. Epub 2010 Apr 20. J Exp Bot. 2010. PMID: 20406785 Free PMC article.
References
-
- Kuroiwa T. The replication, differentiation, and inheritance of plastids with emphasis on the concept of organelle nuclei. International Review of Cytology. 1991;128:1–61.
-
- Miyamura S, Nagata T, Kuroiwa T. Quantitative fluorescence microscopy on dynamic changes of plastid nucleoids during wheat development. Protoplasma. 1986;133:66–72. doi: 10.1007/BF01293188. - DOI
Grants and funding
LinkOut - more resources
Full Text Sources
