

Human and automated detection of high-frequency oscillations in clinical intracranial EEG recordings
- PMID: 17382583
- PMCID: PMC2020804
- DOI: 10.1016/j.clinph.2006.12.019
Human and automated detection of high-frequency oscillations in clinical intracranial EEG recordings
Abstract
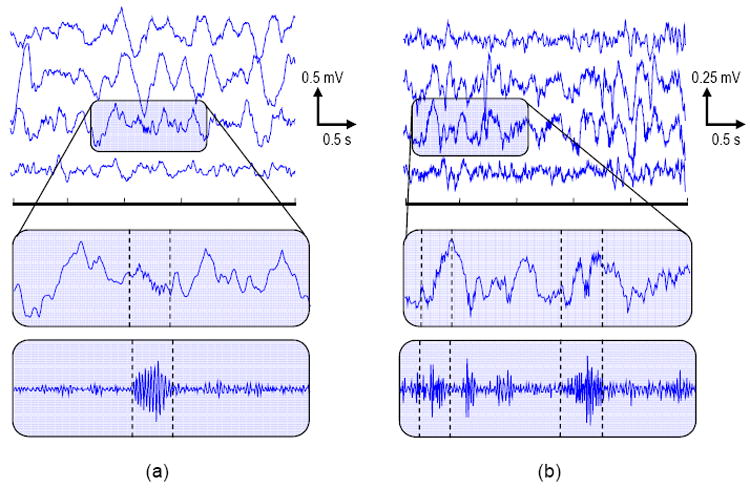
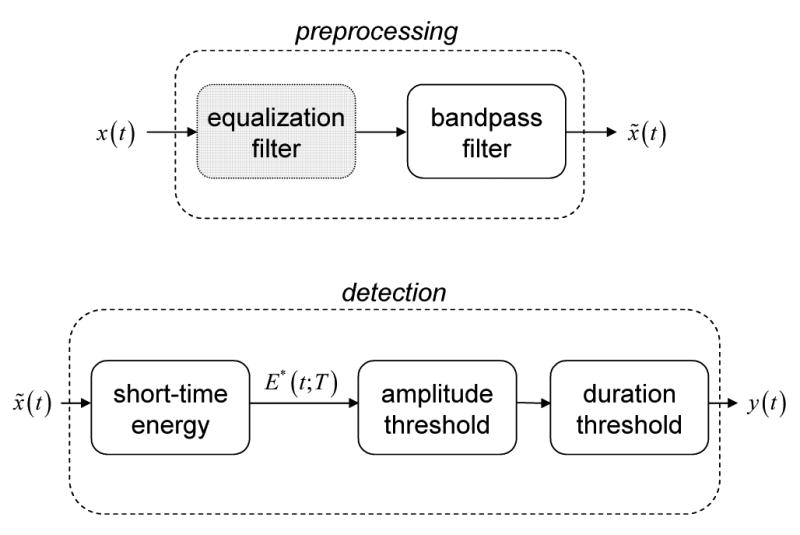
Objective: Recent studies indicate that pathologic high-frequency oscillations (HFOs) are signatures of epileptogenic brain. Automated tools are required to characterize these events. We present a new algorithm tuned to detect HFOs from 30 to 85 Hz, and validate it against human expert electroencephalographers.
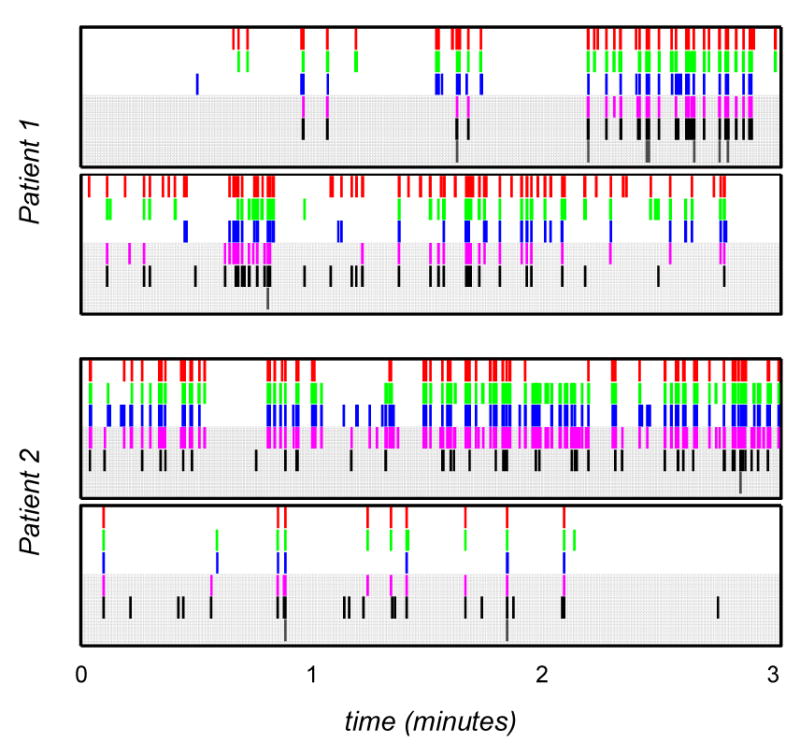
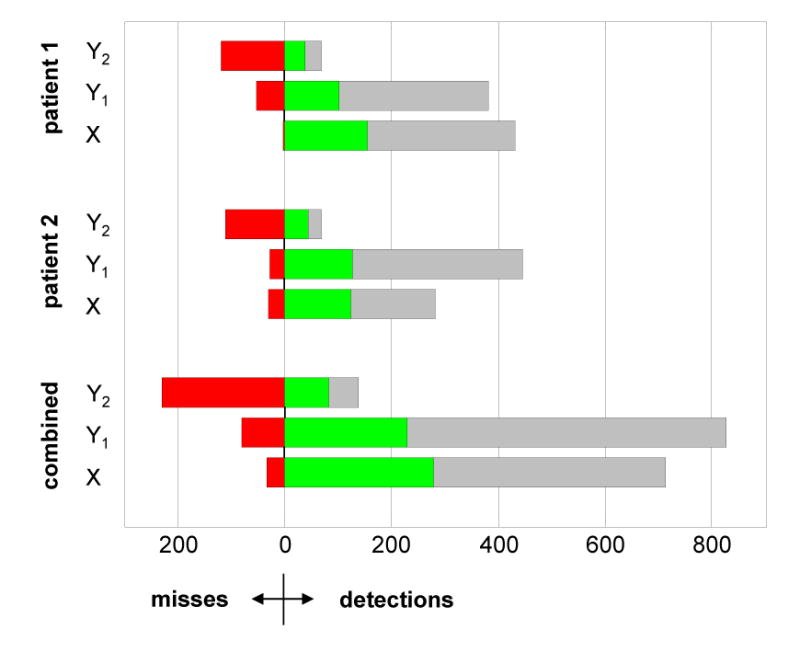
Methods: We randomly selected 28 3-min single-channel epochs of intracranial EEG (IEEG) from two patients. Three human reviewers and three automated detectors marked all records to identify candidate HFOs. Subsequently, human reviewers verified all markings.
Results: A total of 1330 events were collectively identified. The new method presented here achieved 89.7% accuracy against a consensus set of human expert markings. A one-way ANOVA determined no difference between the mean F-measures of the human reviewers and automated algorithm. Human kappa statistics (mean kappa=0.38) demonstrated marginal identification consistency, primarily due to false negative errors.
Conclusions: We present an HFO detector that improves upon existing algorithms, and performs as well as human experts on our test data set. Validation of detector performance must be compared to more than one expert because of interrater variability.
Significance: This algorithm will be useful for analyzing large EEG databases to determine the pathophysiological significance of HFO events in human epileptic networks.
Figures
References
-
- Alarcon G, Binnie CD, Elwes RD, Polkey CE. Power spectrum and intracranial EEG patterns at seizure onset in partial epilepsy. Electroencephalogr Clin Neurophysiol. 1995;94(5):326–337. - PubMed
-
- Allen PJ, Fish DR, Smith SJ. Very high-frequency rhythmic activity during SEEG suppression in frontal lobe epilepsy. Electroencephalogr Clin Neurophysiol. 1992;82(2):155–159. - PubMed
-
- Berger H. Über das Elektrenkephalogramm des Menschen. I Mitteilung Arch Psychiatr Nervenkr. 1929;87:527–570.
-
- Bragin A, Engel J, Jr, Wilson CL, Fried I, Buzsaki G. High-frequency oscillations in human brain. Hippocampus. 1999a;9(2):137–142. - PubMed
-
- Bragin A, Engel J, Jr, Wilson CL, Fried I, Mathern GW. Hippocampal and entorhinal cortex high-frequency oscillations (100--500 Hz) in human epileptic brain and in kainic acid-treated rats with chronic seizures. Epilepsia. 1999b;40(2):127–37. - PubMed
Publication types
MeSH terms
Grants and funding
LinkOut - more resources
Full Text Sources
Other Literature Sources
