. 2007 Jun;18(6):997-1006.
doi: 10.1016/j.jasms.2007.02.009. Epub 2007 Feb 22.

Stable isotope labeling tandem mass spectrometry (SILT) to quantify protein production and clearance rates

Affiliations

Stable isotope labeling tandem mass spectrometry (SILT) to quantify protein production and clearance rates

Randall J Bateman et al. J Am Soc Mass Spectrom. 2007 Jun.

Abstract

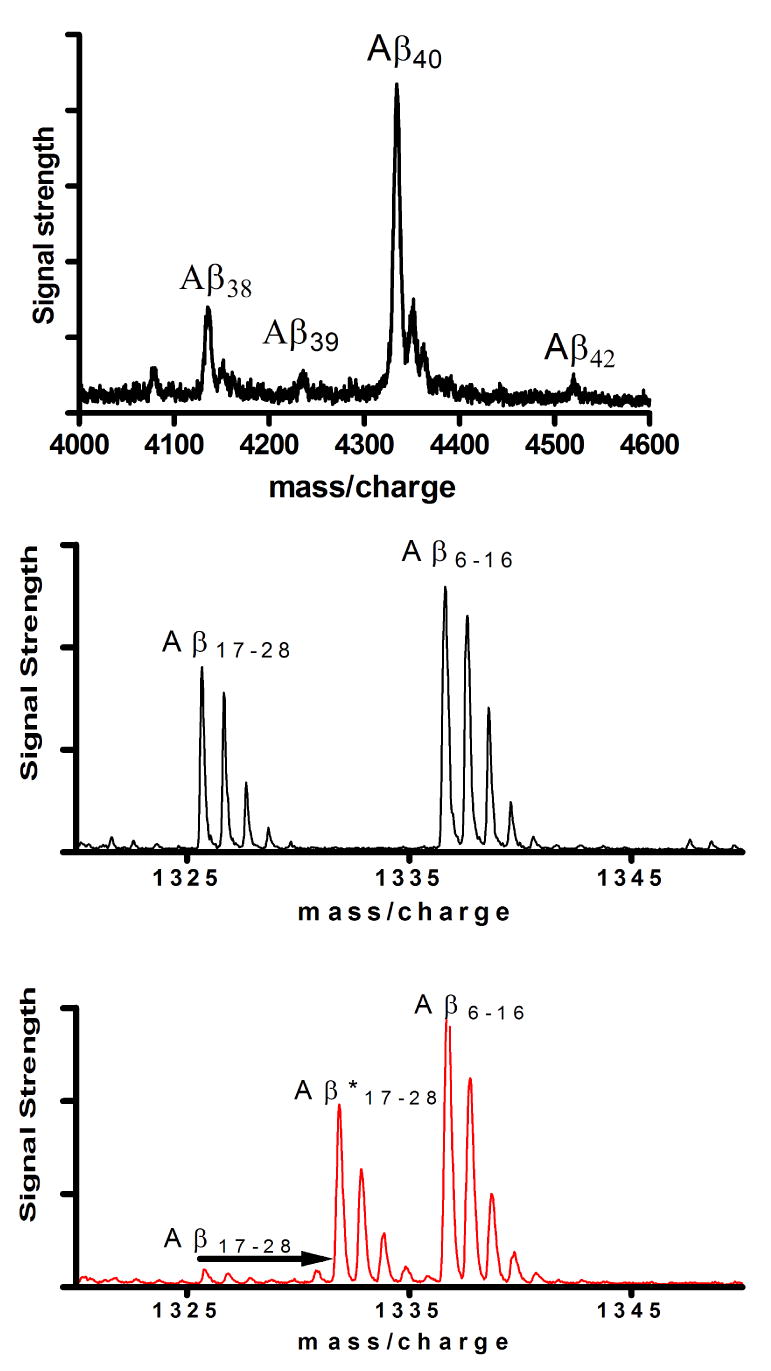
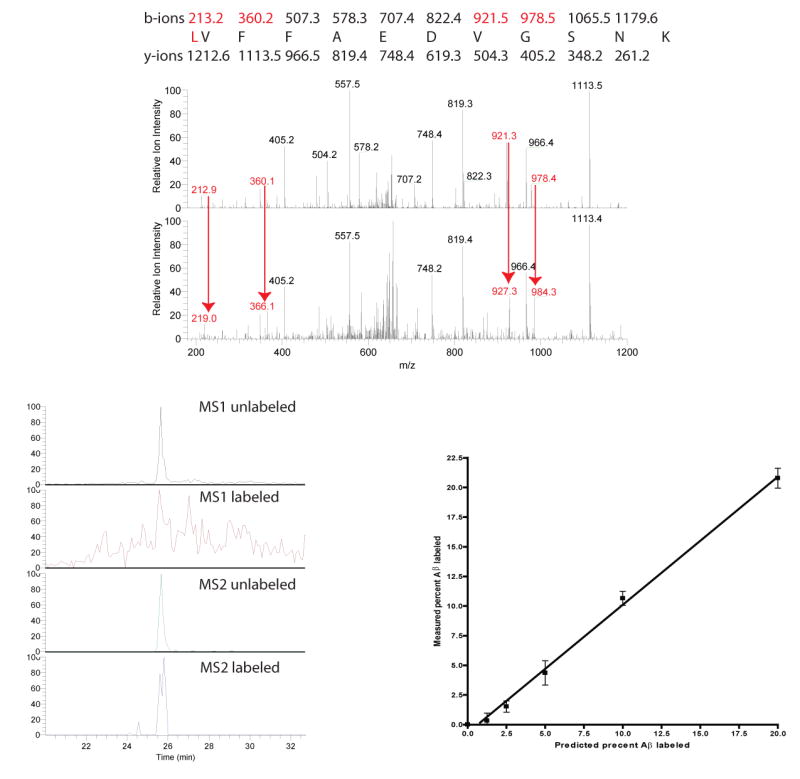
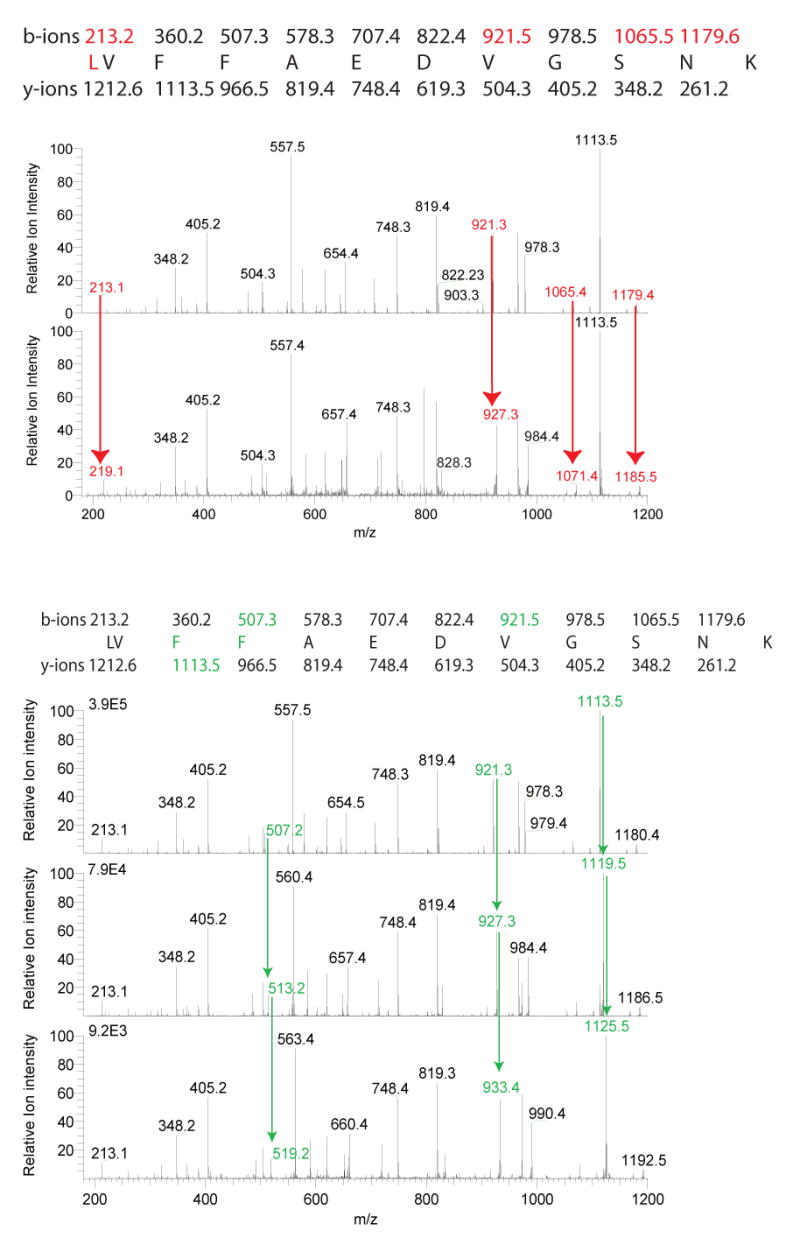
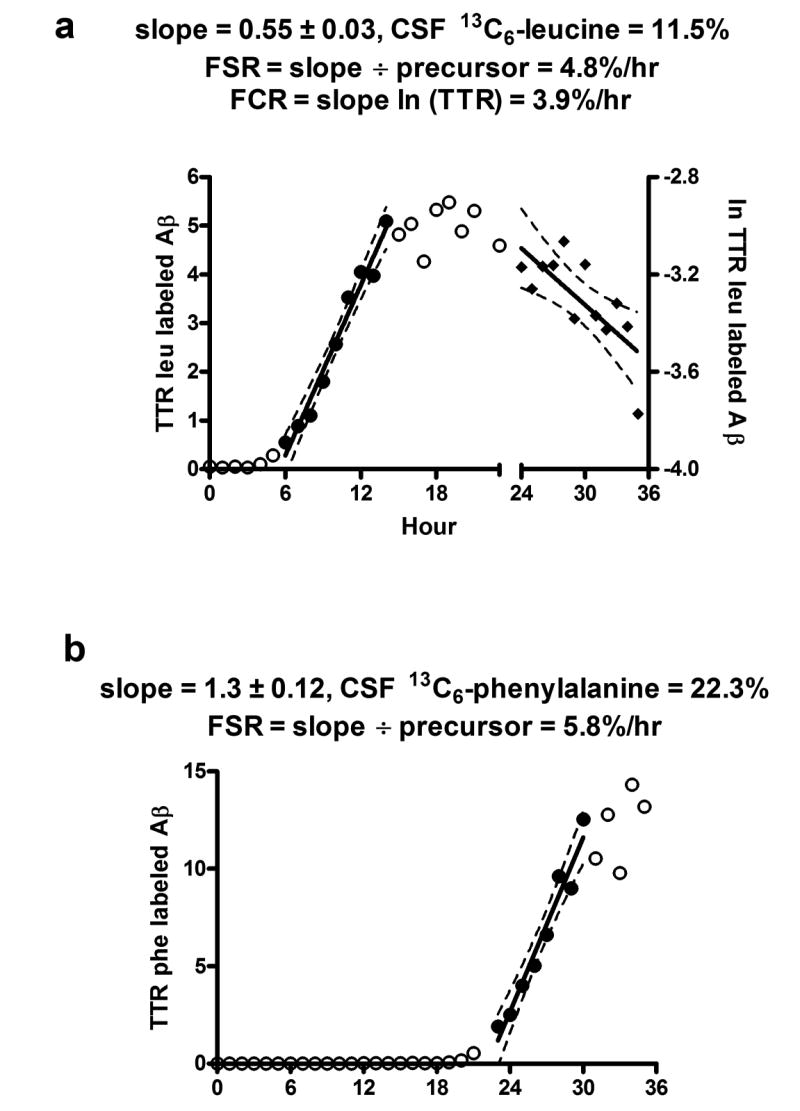
In all biological systems, protein amount is a function of the rate of production and clearance. The speed of a response to a disturbance in protein homeostasis is determined by turnover rate. Quantifying alterations in protein synthesis and clearance rates is vital to understanding disease pathogenesis (e.g., aging, inflammation). No methods currently exist for quantifying production and clearance rates of low-abundance (femtomole) proteins in vivo. We describe a novel, mass spectrometry-based method for quantitating low-abundance protein synthesis and clearance rates in vitro and in vivo in animals and humans. The utility of this method is demonstrated with amyloid-beta (Abeta), an important low-abundance protein involved in Alzheimer's disease pathogenesis. We used in vivo stable isotope labeling, immunoprecipitation of Abeta from cerebrospinal fluid, and quantitative liquid chromatography electrospray-ionization tandem mass spectrometry (LC-ESI-tandem MS) to quantify human Abeta protein production and clearance rates. The method is sensitive and specific for stable isotope-labeled amino acid incorporation into CNS Abeta (+/-1% accuracy). This in vivo method can be used to identify pathophysiologic changes in protein metabolism and may serve as a biomarker for monitoring disease risk, progression, or response to novel therapeutic agents. The technique is adaptable to other macromolecules, such as carbohydrates or lipids.


Figures

Figure 1
Figure 1. Quantitation by tandem-MS of amino acid stable isotope labeling of newly synthesized proteins
(a) Trypsin fragments of the protein are separated and concentrated using liquid chromatography before mass spectrometry for detection and quantification of both labeled and unlabeled fragments using MS/MS ions. (b) Diagram of quantitation of labeled and unlabeled Aβ17-28 and graph of labeling curve to calculate synthesis and clearance rates of proteins.
Figure 2
Figure 2. MALDI-TOF qualitative analysis of Aß
(a) Aß peptides were immunoprecipitated from human CSF with the central domain anti-Aß antibody, m266, directed against amino acids 13-28. Following immunoprecipitation, Aß was eluted with 100% formic acid and analyzed on a MALDI-TOF mass spectrometer. Mass spectral peaks are noted with their corresponding peptide variants; Aß38, Aß39, Aß40, and Aß42. The level of Aβ42 was approximately 10% of Aβ40 levels, as has been reported previously in human CSF. (b) Unlabeled media from a human neuroglioma cell line producing Aß in vitro was collected and immunoprecipitated. Aß peptides were then cleaved with trypsin at sites 5, 16, and 28 producing the two fragment envelopes shown at masses 1325 and 1336. Note the two mass envelopes of Aß fragments Aβ17-28 (1325) and Aβ6-16 (1336) showing the statistical distribution of natural isotopes in unlabeled Aß. (c) Human neuroglioma cells were cultured for 24 hours in the presence of 13C6-leucine. Media was collected and Aß was immunoprecipitated. Aß peptides were then cleaved with trypsin at sites 5, 16, and 28 producing the fragment envelopes shown at masses 1325, 1331, and 1336. Note the shift of mass (arrow) of Aβ17-28 from 1325 to 1331 that demonstrates the 13C6-leucine label. Aβ6-16 does not contain a leucine, and so is not labeled or mass shifted. A minor amount of Aβ17-28 remains unlabeled.
Figure 3
Figure 3. LCQ quantitation of tandem MS spectra of in vitro unlabeled and labeled Aβ17-28
(a) Neuroglioma cell media that was unlabeled (top) or labeled (bottom) with 13C6-leucine. The spectra were obtained using tandem MS analysis of unlabeled parent ion Aβ17-28 (m=1325) or labeled parent ion Aβ17-28(m=1331) by LCQ-ESI-MS. Note the tandem MS ions containing leucine at Aβ17 (see masses 213, 360, 921, and 978) are mass shifted by 6 Daltons demonstrating the labeled leucine (arrows). The Aß ions without leucine are not labeled and are not mass shifted by 6 Daltons (see mass 348.2 and 405.3 in both spectra). (b) Base peak chromatograms of MS1 versus MS2 quantitation. 2.5% leucine labeled culture was analyzed in the same MS run after immunoprecipitation and trypsin digestion of Aβ. Reconstructed base peak chromatograms demonstrate the signal to noise ratio improvements of MS2 versus MS1 quantitation. (c) Standard curve of labeled Aß to unlabeled Aß. Labeled cultured media was serially diluted with unlabeled media to generate samples for a standard curve. Aß was immuno-precipitated from the media, trypsin digested, and Aβ17-28 fragments were analyzed on a LCQ-ESI-MS and the tandem mass spectra ions were quantitated using custom written software. The predicted percent labeled Aß versus the measured value is shown with a linear regression line.
Figure 4
Figure 4. LTQ quantitation of tandem mass spectra of Aß from human in vivo labeling with two amino acids
(a) Tandem MS spectra of Aβ17-28 from human CSF thirteen hours after in vivo13C6-leucine labeling demonstrate unlabeled Aβ17-28 tandem MS ions (top) and labeled Aβ17-28 tandem MS ions (bottom). The leucine containing tandem MS ions demonstrate the additional six Dalton label, as shown by arrows to leucine containing ions. (b) Tandem MS spectra of Aβ17-28 from human CSF twelve hours after in vivo labeling with 13C6-phenylalanine demonstrate unlabeled ions (top), singly labeled ions (middle) and doubly labeled ions (bottom), as shown by arrows to phenylalanine containing ions.
Figure 5
Figure 5. Two sequential measurements of fractional synthesis rate of Aß in the same participant
The ratio of labeled Aß to unlabeled Aß over 36 hours is shown for a single participant who was intravenously given 13C6-leucine for 0 to 9 hours, followed by phenylalanine given from 16 to 25 hours of the study. Cerebral-spinal fluid was collected hourly during and after labeling for a total of 36 hours. Each hourly sample was immunoprecipitated for Aß, trypsin digested, and analyzed for percent leucine and phenylalanine labeled Aß. Note the rapid increase in leucine labeled Aß to plateau at 12 hours and a subsequent decline in labeled Aß after 24 hours. There is no detectable phenylalanine labeling until hour 20, followed by a rapid rise to plateau. (a)17-28 labeled leucine tandem MS ions were quantified excluding 13C6-phenylalanine containing ions and plotted over 36 hours. Leucine labeled ions are detected 5 hours after onset of labeling. FSR was calculated using the slope of the linear regression shown divided by the 13C6-leucine enrichment in CSF. (b)13C6-phenylalanine labeled Aβ17-28 tandem MS ions were quantified excluding 13C6-leucine containing ions and plotted over 36 hours from the same tandem MS data files as in (a). There are not detectable phenylalanine labeled ions during peak leucine labeled Aß times (5-20 hours). Phenylalanine labeled ions are detected 5 hours after onset of 13C6-phenylalanine labeling. FSR was calculated using the slope of the linear regression shown divided by the 13C6-phenylalanine enrichment in CSF.

References

    1. Andersen JS, Lam YW, Leung AK, Ong SE, Lyon CE, Lamond AI, Mann M. Nucleolar proteome dynamics. Nature. 2005;433:77–83. - PubMed
    1. Zhang G, Neubert TA. Automated comparative proteomics based on multiplex tandem mass spectrometry and stable isotope labeling. Mol Cell Proteomics. 2006;5:401–11. - PubMed
    1. Ong SE, Blagoev B, Kratchmarova I, Kristensen DB, Steen H, Pandey A, Mann M. Stable isotope labeling by amino acids in cell culture, SILAC, as a simple and accurate approach to expression proteomics. Mol Cell Proteomics. 2002;1:376–86. - PubMed
    1. Wu CC, MacCoss MJ, Howell KE, Matthews DE, Yates JR. 3rd Metabolic labeling of mammalian organisms with stable isotopes for quantitative proteomic analysis. Anal Chem. 2004;76:4951–9. - PubMed
    1. Jaleel A, Nehra V, Persson XM, Boirie Y, Bigelow M, Nair KS. In Vivo Measurement Of Synthesis Rate Of Multiple Plasma Proteins In Humans. Am J Physiol Endocrinol Metab. 2006 - PubMed

Publication types