

Hippocampus-specific fMRI group activation analysis using the continuous medial representation
- PMID: 17383900
- PMCID: PMC2262289
- DOI: 10.1016/j.neuroimage.2007.01.029
Hippocampus-specific fMRI group activation analysis using the continuous medial representation
Abstract
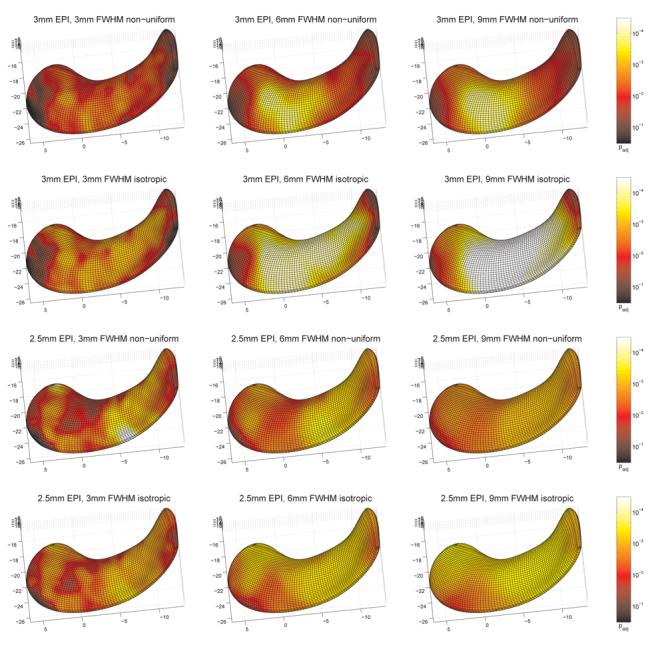
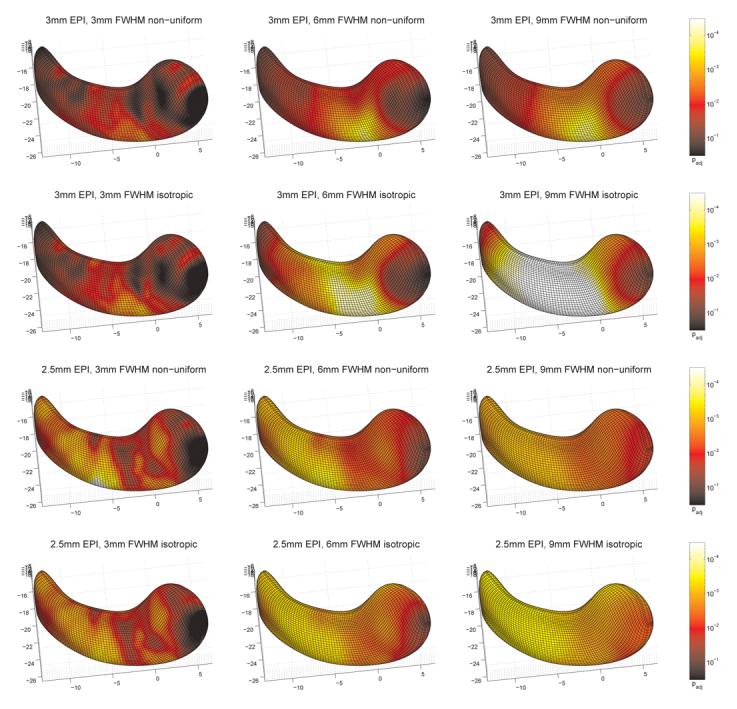
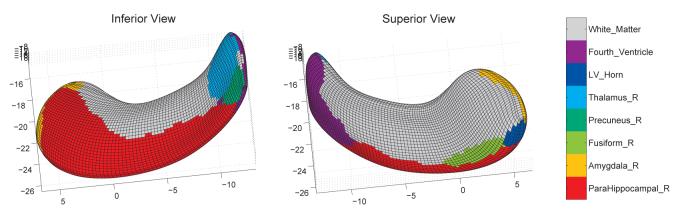
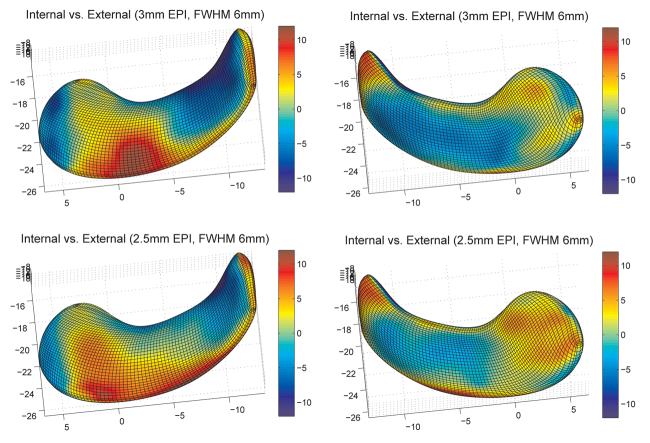
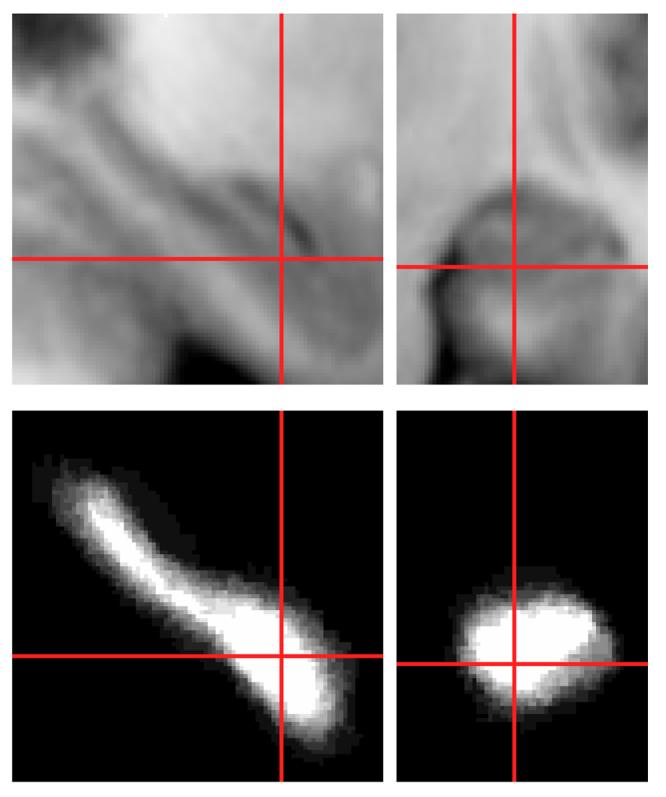
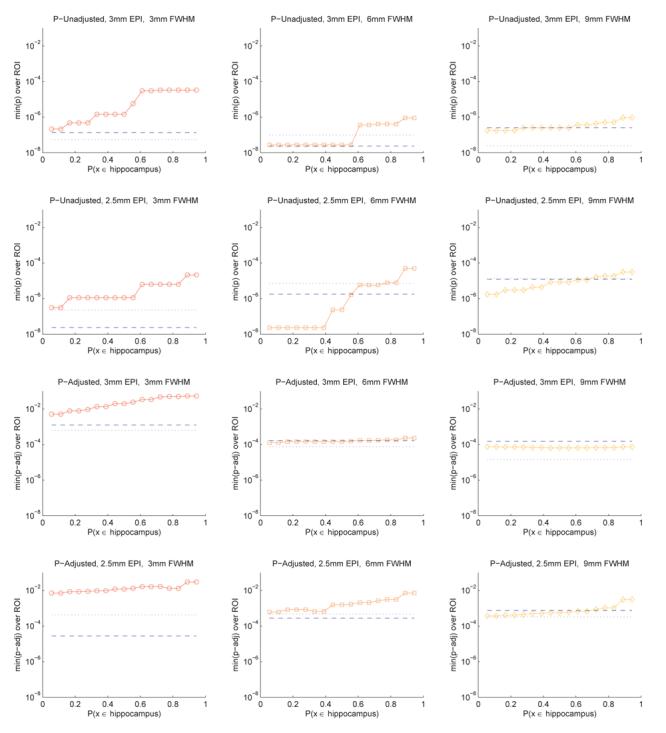
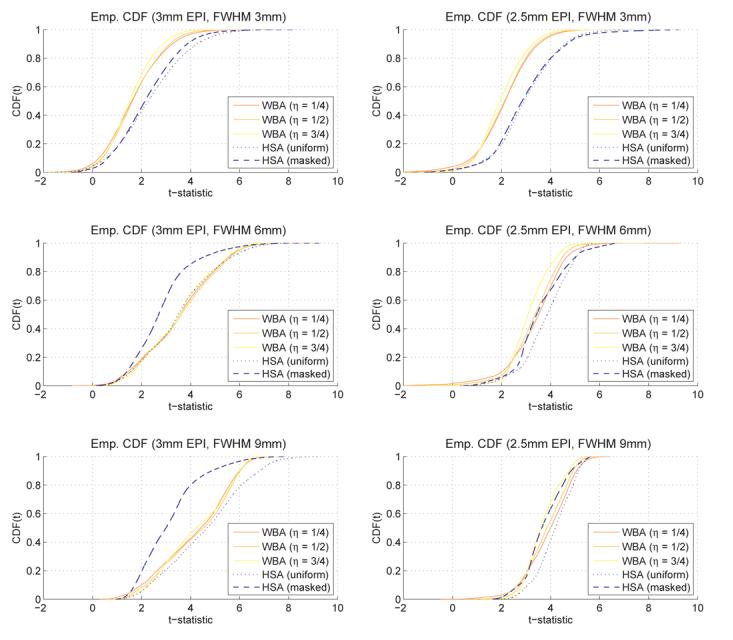
We present a new shape-based approach for regional group activation analysis in fMRI studies. The method restricts anatomical normalization, spatial smoothing and random effects statistical analysis to the space inside and around a structure of interest. Normalization involves finding intersubject correspondences between manually outlined masks, and it leverages the continuous medial representation, which makes it possible to extend surface-based shape correspondences to the space inside and outside of structures. Our approach is an alternative to whole-brain normalization in cases where the latter may fail due to anatomical variability or pathology. It also provides an opportunity to analyze the shape and thickness of structures concurrently with functional activation. We apply the technique to the hippocampus and evaluate it using data from a visual scene encoding fMRI study, where activation in the hippocampus is expected. We produce detailed statistical maps of hippocampal activation, as well as maps comparing activation inside and outside of the hippocampus. We find that random effects statistics computed by the new approach are more significant than those produced using the Statistical Parametric Mapping framework (Friston, K.J., Holmes, A.P., Worsley, K.J., Poline, J.-P., Firth, C.D., Frackowiak, R.S.J. 1994, Statistical parametric maps in functional imaging: a general linear approach. Human Brain Mapping, 2(4): 189-210) at low levels of smoothing, suggesting that greater specificity can be achieved by the new method without a severe tradeoff in sensitivity.
Figures
Similar articles
-
Hippocampus-specific fMRI group activation analysis with continuous M-Reps.Med Image Comput Comput Assist Interv. 2006;9(Pt 2):284-91. doi: 10.1007/11866763_35. Med Image Comput Comput Assist Interv. 2006. PMID: 17354783
-
Regional analysis of hippocampal activation during memory encoding and retrieval: fMRI study.Hippocampus. 2003;13(1):164-74. doi: 10.1002/hipo.10064. Hippocampus. 2003. PMID: 12625466
-
[Data processing of functional magnetic resonance of brain based on statistical parametric mapping].Sheng Wu Yi Xue Gong Cheng Xue Za Zhi. 2007 Apr;24(2):477-80. Sheng Wu Yi Xue Gong Cheng Xue Za Zhi. 2007. PMID: 17591287 Review. Chinese.
-
Continuous medial representation for anatomical structures.IEEE Trans Med Imaging. 2006 Dec;25(12):1547-64. doi: 10.1109/tmi.2006.884634. IEEE Trans Med Imaging. 2006. PMID: 17167991
-
Unfolding the human hippocampus with high resolution structural and functional MRI.Anat Rec. 2001 Apr;265(2):111-20. doi: 10.1002/ar.1061. Anat Rec. 2001. PMID: 11323773 Review.
Cited by
-
Developmental changes in hippocampal shape among preadolescent children.Int J Dev Neurosci. 2013 Nov;31(7):473-81. doi: 10.1016/j.ijdevneu.2013.06.001. Epub 2013 Jun 14. Int J Dev Neurosci. 2013. PMID: 23773912 Free PMC article.
-
Multivariate analysis of structural and diffusion imaging in traumatic brain injury.Acad Radiol. 2008 Nov;15(11):1360-75. doi: 10.1016/j.acra.2008.07.007. Acad Radiol. 2008. PMID: 18995188 Free PMC article.
-
Structure specific analysis of the hippocampus in temporal lobe epilepsy.Hippocampus. 2009 Jun;19(6):517-25. doi: 10.1002/hipo.20620. Hippocampus. 2009. PMID: 19437496 Free PMC article.
-
A tract-specific framework for white matter morphometry combining macroscopic and microscopic tract features.Med Image Anal. 2010 Oct;14(5):666-73. doi: 10.1016/j.media.2010.05.002. Epub 2010 May 26. Med Image Anal. 2010. PMID: 20547469 Free PMC article.
-
Heterogeneity of functional activation during memory encoding across hippocampal subfields in temporal lobe epilepsy.Neuroimage. 2011 Oct 15;58(4):1121-30. doi: 10.1016/j.neuroimage.2011.06.085. Epub 2011 Jul 7. Neuroimage. 2011. PMID: 21763431 Free PMC article.
References
-
- Ashburner J, Friston K. Multimodal image coregistration and partitioning–a unified framework. Neuroimage. 1997;6(3):209–17. - PubMed
-
- Ashburner J, Friston KJ. Voxel-based morphometry–the methods. Neuroimage. 2000;11(6 Pt 1):805–21. - PubMed
-
- Avants B, Schoenemann P, Gee J. Lagrangian frame diffeomorphic image registration: Morphometric comparison of human and chimpanzee cortex. Medical Image Analysis. 2005 In Press. - PubMed
-
- Benjamini Y, Yekutieli D. The control of the false discovery rate in multiple testing under dependency. The Annals of Statistics. 2001;29(4):1165–1188.
Publication types
MeSH terms
Grants and funding
LinkOut - more resources
Full Text Sources
