

Fretting about FRET: correlation between kappa and R
- PMID: 17384068
- PMCID: PMC1877789
- DOI: 10.1529/biophysj.106.092650
Fretting about FRET: correlation between kappa and R
Abstract
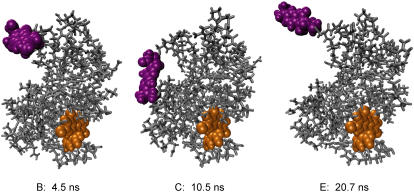
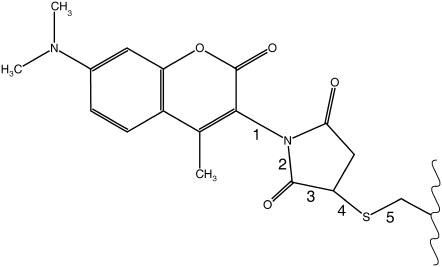
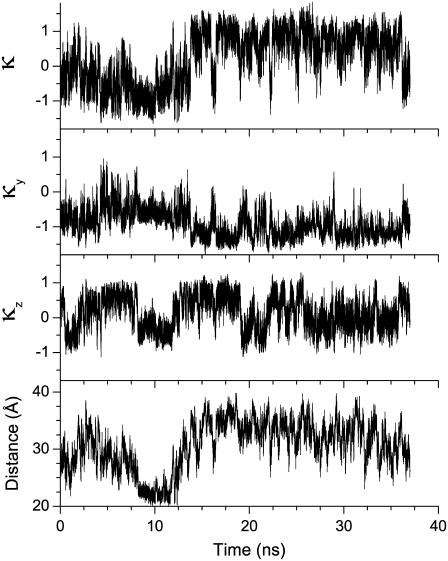
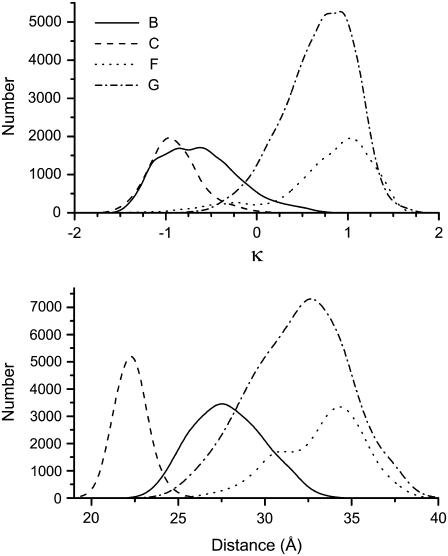
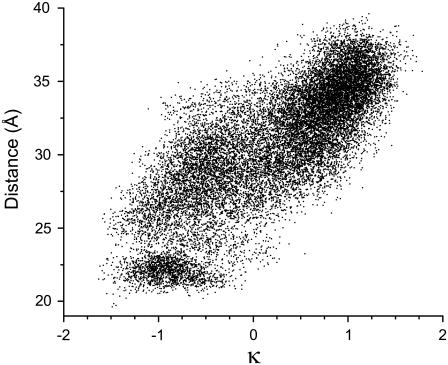
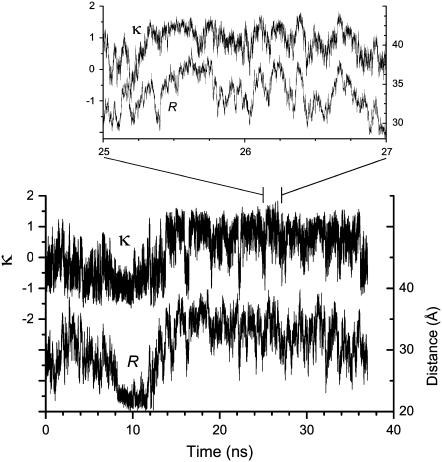
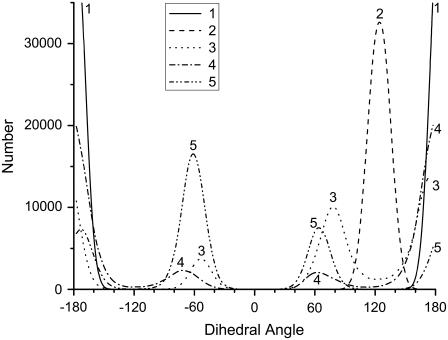
Molecular dynamics simulations were used to examine the structural dynamics of two fluorescent probes attached to a typical protein, hen egg-white lysozyme (HEWL). The donor probe (D) was attached via a succinimide group, consistent with the commonly-used maleimide conjugation chemistry, and the acceptor probe (A) was bound into the protein as occurs naturally for HEWL and the dye Eosin Y. The <kappa(2)> is found to deviate significantly from the theoretical value and high correlation between the orientation factor kappa and the distance R is observed. The correlation is quantified using several possible fixed A orientations and correlation as high as 0.80 is found between kappa and R and as high as 0.68 between kappa(2) and R. The presence of this correlation highlights the fact that essentially all fluorescence-detected resonance energy transfer studies have assumed that kappa and R are independent--an assumption that is clearly not justified in the system studied here. The correlation results in the quantities <kappa(2)R(-)(6)> and <kappa(2)> < R(-)(6)> differing by a factor of 1.6. The observed correlation between kappa and R is caused by the succinimide linkage between the D and HEWL, which is found to be relatively inflexible.
Figures
Similar articles
-
Fluorescence resonance energy transfer between an anionic conjugated polymer and a dye-labeled lysozyme aptamer for specific lysozyme detection.Chem Commun (Camb). 2009 May 7;(17):2284-6. doi: 10.1039/b820001g. Epub 2009 Mar 4. Chem Commun (Camb). 2009. PMID: 19377660
-
Fluorescent resonant energy transfer: correlated fluctuations of donor and acceptor.J Chem Phys. 2007 Dec 14;127(22):221101. doi: 10.1063/1.2812540. J Chem Phys. 2007. PMID: 18081378
-
Exploring homo-FRET to quantify the oligomer stoichiometry of membrane-bound proteins involved in a cooperative partition equilibrium.Phys Chem Chem Phys. 2014 Sep 14;16(34):18105-17. doi: 10.1039/c4cp00060a. Phys Chem Chem Phys. 2014. PMID: 24722583
-
Development of probes for cellular functions using fluorescent proteins and fluorescence resonance energy transfer.Annu Rev Biochem. 2011;80:357-73. doi: 10.1146/annurev-biochem-072909-094736. Annu Rev Biochem. 2011. PMID: 21529159 Review.
-
Distance determination in protein-DNA complexes using fluorescence resonance energy transfer.Methods Mol Biol. 2006;335:243-55. doi: 10.1385/1-59745-069-3:243. Methods Mol Biol. 2006. PMID: 16785632 Review.
Cited by
-
Real-time fluorescent image analysis of DNA spot hybridization kinetics to assess microarray spot heterogeneity.Anal Chem. 2012 Nov 6;84(21):9379-87. doi: 10.1021/ac302165h. Epub 2012 Oct 29. Anal Chem. 2012. PMID: 23043216 Free PMC article.
-
Conformational heterogeneity of a leucine enkephalin analogue in aqueous solution and sodium dodecyl sulfate micelles: comparison of time-resolved FRET and molecular dynamics simulations.J Phys Chem B. 2009 Oct 29;113(43):14381-92. doi: 10.1021/jp903302k. J Phys Chem B. 2009. PMID: 19780516 Free PMC article.
-
Green tea polyphenol epigallocatechin-O-gallate induces cell death by acid sphingomyelinase activation in chronic myeloid leukemia cells.Oncol Rep. 2015 Sep;34(3):1162-8. doi: 10.3892/or.2015.4086. Epub 2015 Jun 26. Oncol Rep. 2015. PMID: 26135316 Free PMC article.
-
Molecular dynamics simulations reveal that AEDANS is an inert fluorescent probe for the study of membrane proteins.Eur Biophys J. 2010 Jan;39(2):229-39. doi: 10.1007/s00249-009-0527-9. Epub 2009 Aug 11. Eur Biophys J. 2010. PMID: 19669748 Free PMC article.
-
Estimating the distance separating fluorescent protein FRET pairs.Methods. 2014 Mar 15;66(2):131-8. doi: 10.1016/j.ymeth.2013.06.021. Epub 2013 Jun 25. Methods. 2014. PMID: 23811334 Free PMC article.
References
-
- Clegg, R. M. 1996. Fluorescence resonance energy transfer. In Fluorescence Imaging and Microscopy. Chemical Analysis, Vol. 137. X. F. Wang, and B. Herman, editors. Wiley Interscience, New York.
-
- Andrews, D. L., and A. A. Demidov. 1999. Resonance Energy Transfer. John Wiley & Sons, New York.
-
- Stryer, L. 1978. Fluorescence energy transfer as a spectroscopic ruler. Annu. Rev. Biochem. 47:819–846. - PubMed
-
- Dale, R. E., and J. Eisinger. 1974. Intramolecular distances determined by energy transfer. Dependence on orientational freedom of donor and acceptor. Biopolymers. 13:1573–1605.
Publication types
MeSH terms
Substances
LinkOut - more resources
Full Text Sources
