

Backbone structure of the amantadine-blocked trans-membrane domain M2 proton channel from Influenza A virus
- PMID: 17384070
- PMCID: PMC1877758
- DOI: 10.1529/biophysj.106.090183
Backbone structure of the amantadine-blocked trans-membrane domain M2 proton channel from Influenza A virus
Abstract
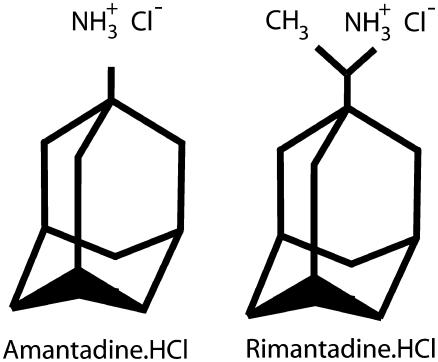
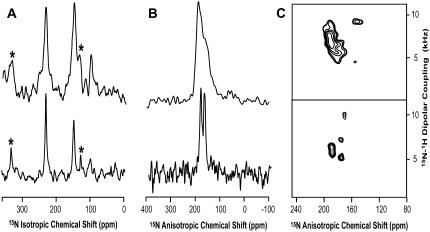
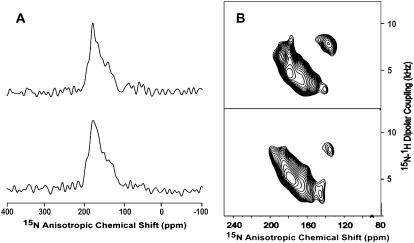
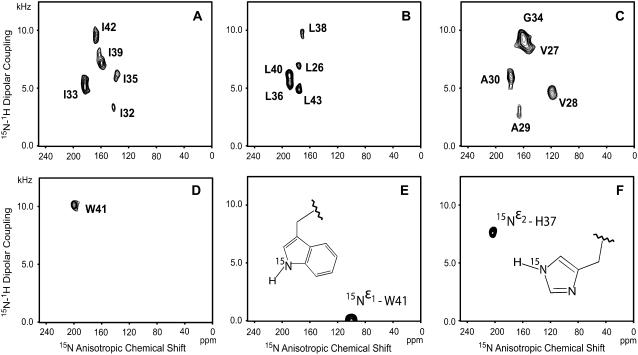
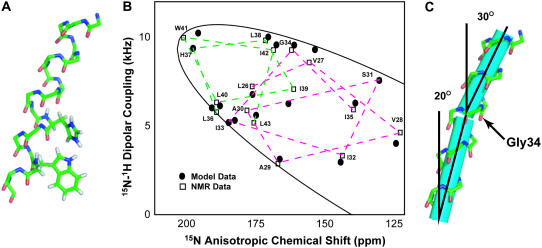
Amantadine is known to block the M2 proton channel of the Influenza A virus. Here, we present a structure of the M2 trans-membrane domain blocked with amantadine, built using orientational constraints obtained from solid-state NMR polarization-inversion-spin-exchange-at-the-magic-angle experiments. The data indicates a kink in the monomer between two helical fragments having 20 degrees and 31 degrees tilt angles with respect to the membrane normal. This monomer structure is then used to construct a plausible model of the tetrameric amantadine-blocked M2 trans-membrane channel. The influence of amantadine binding through comparative cross polarization magic-angle spinning spectra was also observed. In addition, spectra are shown of the amantadine-resistant mutant, S31N, in the presence and absence of amantadine.
Figures

Similar articles
-
The chemical and dynamical influence of the anti-viral drug amantadine on the M2 proton channel transmembrane domain.Biophys J. 2007 Jul 1;93(1):276-83. doi: 10.1529/biophysj.106.102103. Epub 2007 Apr 13. Biophys J. 2007. PMID: 17434944 Free PMC article.
-
Structure of amantadine-bound M2 transmembrane peptide of influenza A in lipid bilayers from magic-angle-spinning solid-state NMR: the role of Ser31 in amantadine binding.J Mol Biol. 2009 Jan 30;385(4):1127-41. doi: 10.1016/j.jmb.2008.11.022. Epub 2008 Nov 24. J Mol Biol. 2009. PMID: 19061899 Free PMC article.
-
Drug-induced conformational and dynamical changes of the S31N mutant of the influenza M2 proton channel investigated by solid-state NMR.J Am Chem Soc. 2013 Jul 3;135(26):9885-97. doi: 10.1021/ja4041412. Epub 2013 Jun 21. J Am Chem Soc. 2013. PMID: 23758317 Free PMC article.
-
Influenza M2 proton channels.Biochim Biophys Acta. 2011 Feb;1808(2):522-9. doi: 10.1016/j.bbamem.2010.04.015. Epub 2010 May 6. Biochim Biophys Acta. 2011. PMID: 20451491 Free PMC article. Review.
-
Flu channel drug resistance: a tale of two sites.Protein Cell. 2010 Mar;1(3):246-58. doi: 10.1007/s13238-010-0025-y. Epub 2010 Feb 23. Protein Cell. 2010. PMID: 21203971 Free PMC article. Review.
Cited by
-
Magic angle spinning NMR of viruses.Prog Nucl Magn Reson Spectrosc. 2015 Apr;86-87:21-40. doi: 10.1016/j.pnmrs.2015.02.003. Epub 2015 Feb 16. Prog Nucl Magn Reson Spectrosc. 2015. PMID: 25919197 Free PMC article. Review.
-
Viroporins, Examples of the Two-Stage Membrane Protein Folding Model.Viruses. 2015 Jun 26;7(7):3462-82. doi: 10.3390/v7072781. Viruses. 2015. PMID: 26131957 Free PMC article. Review.
-
Inhibitors of the M2 Proton Channel Engage and Disrupt Transmembrane Networks of Hydrogen-Bonded Waters.J Am Chem Soc. 2018 Nov 14;140(45):15219-15226. doi: 10.1021/jacs.8b06741. Epub 2018 Sep 12. J Am Chem Soc. 2018. PMID: 30165017 Free PMC article.
-
Atomic structures of closed and open influenza B M2 proton channel reveal the conduction mechanism.Nat Struct Mol Biol. 2020 Feb;27(2):160-167. doi: 10.1038/s41594-019-0371-2. Epub 2020 Feb 3. Nat Struct Mol Biol. 2020. PMID: 32015551 Free PMC article.
-
Imidazole-Imidazole Hydrogen Bonding in the pH-Sensing Histidine Side Chains of Influenza A M2.J Am Chem Soc. 2020 Feb 12;142(6):2704-2708. doi: 10.1021/jacs.9b10984. Epub 2020 Jan 30. J Am Chem Soc. 2020. PMID: 31970979 Free PMC article.
References
-
- Hille, B. 2001. Ionic Channels of Excitable Membranes. Sinauer Associates, Sunderland, MA.
-
- Morbidity and Mortality Weekly Report. 2006. High levels of adamantane resistance among Influenza A (H3N2) viruses and interim guidelines for use of antiviral agents. United States, 2005–06 Influenza season. Dispatch 55, January 26. - PubMed
-
- Wang, C., R. A. Lamb, and L. H. Pinto. 1994. Direct measurement of the influenza A virus protein ion channel activity in mammalian cells. Virology. 205:133–140. - PubMed
Publication types
MeSH terms
Substances
Grants and funding
LinkOut - more resources
Full Text Sources
Other Literature Sources
