

From single-cell genetic architecture to cell population dynamics: quantitatively decomposing the effects of different population heterogeneity sources for a genetic network with positive feedback architecture
- PMID: 17384073
- PMCID: PMC1877777
- DOI: 10.1529/biophysj.106.100271
From single-cell genetic architecture to cell population dynamics: quantitatively decomposing the effects of different population heterogeneity sources for a genetic network with positive feedback architecture
Abstract
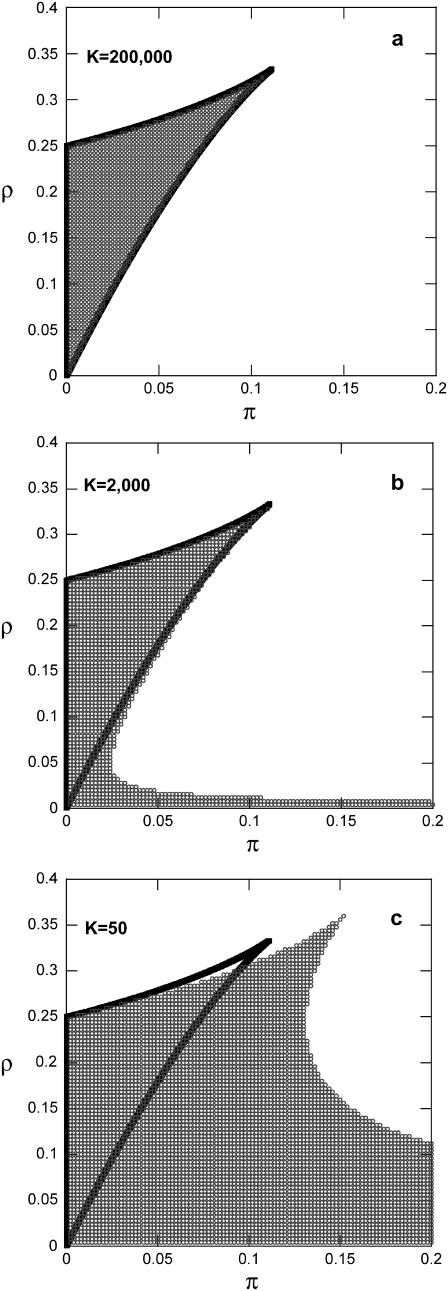
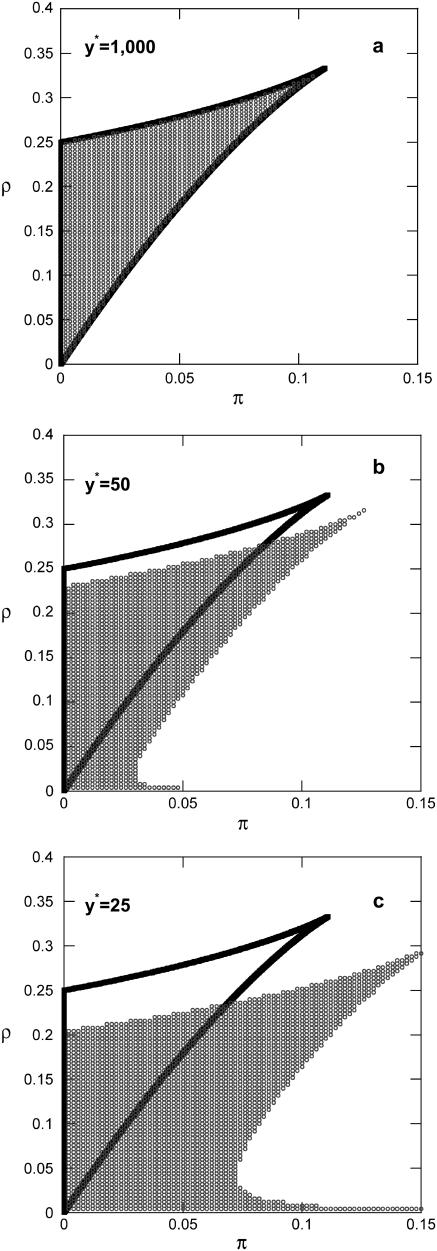
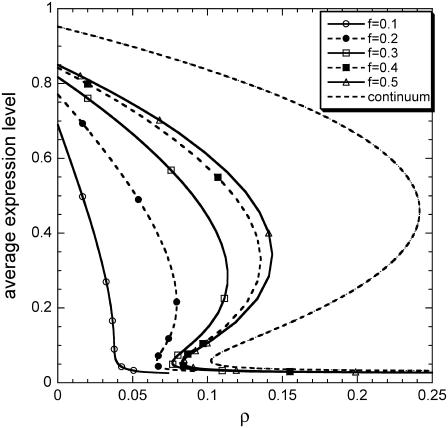
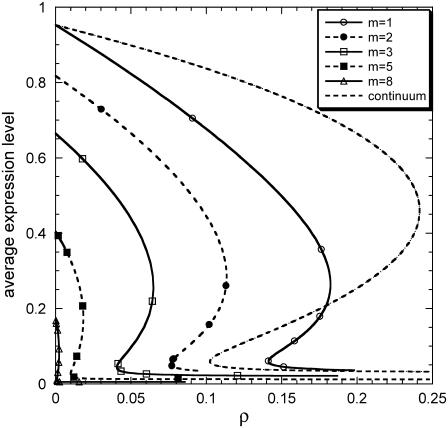
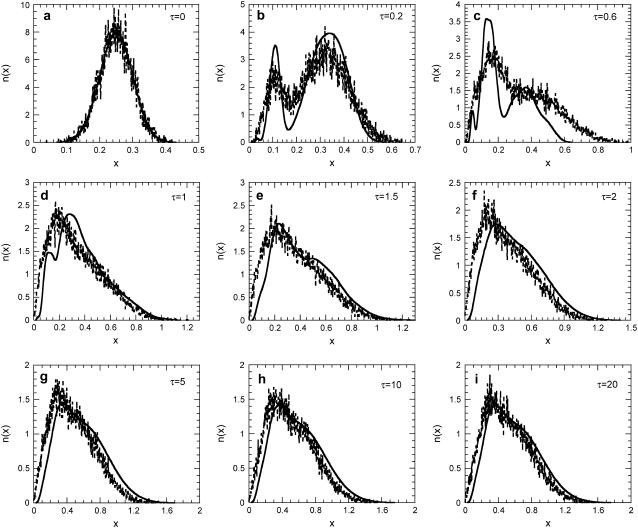
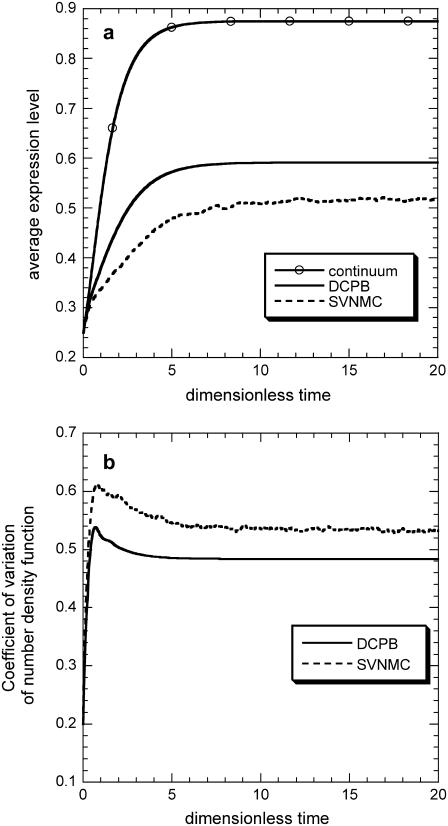
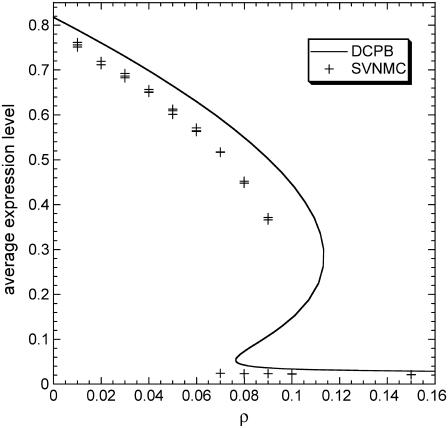
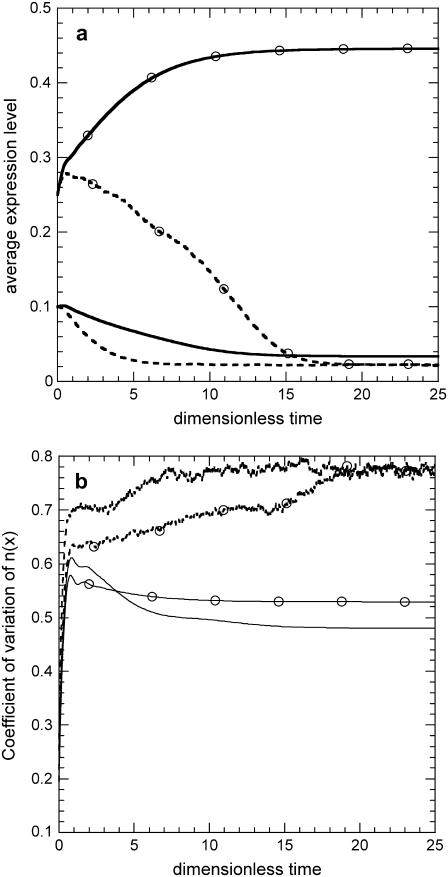
Phenotypic cell-to-cell variability or cell population heterogeneity originates from two fundamentally different sources: unequal partitioning of cellular material at cell division and stochastic fluctuations associated with intracellular reactions. We developed a mathematical and computational framework that can quantitatively isolate both heterogeneity sources and applied it to a genetic network with positive feedback architecture. The framework consists of three vastly different mathematical formulations: a), a continuum model, which completely neglects population heterogeneity; b), a deterministic cell population balance model, which accounts for population heterogeneity originating only from unequal partitioning at cell division; and c), a fully stochastic model accommodating both sources of population heterogeneity. The framework enables the quantitative decomposition of the effects of the different population heterogeneity sources on system behavior. Our results indicate the importance of cell population heterogeneity in accurately predicting even average population properties. Moreover, we find that unequal partitioning at cell division and sharp division rates shrink the region of the parameter space where the population exhibits bistable behavior, a characteristic feature of networks with positive feedback architecture. In addition, intrinsic noise at the single-cell level due to slow operator fluctuations and small numbers of molecules further contributes toward the shrinkage of the bistability regime at the cell population level. Finally, the effect of intrinsic noise at the cell population level was found to be markedly different than at the single-cell level, emphasizing the importance of simulating entire cell populations and not just individual cells to understand the complex interplay between single-cell genetic architecture and behavior at the cell population level.
Figures
Similar articles
-
Stochastic and deterministic simulations of heterogeneous cell population dynamics.J Theor Biol. 2006 Aug 7;241(3):690-706. doi: 10.1016/j.jtbi.2006.01.005. Epub 2006 Feb 20. J Theor Biol. 2006. PMID: 16487980
-
A mathematical and computational approach for integrating the major sources of cell population heterogeneity.J Theor Biol. 2010 Sep 7;266(1):41-61. doi: 10.1016/j.jtbi.2010.06.002. Epub 2010 Jun 8. J Theor Biol. 2010. PMID: 20685607 Free PMC article.
-
The effect of negative feedback on noise propagation in transcriptional gene networks.Chaos. 2006 Jun;16(2):026108. doi: 10.1063/1.2208927. Chaos. 2006. PMID: 16822040
-
Modeling cell-to-cell stochastic variability in intrinsic apoptosis pathway.Annu Int Conf IEEE Eng Med Biol Soc. 2012;2012:5498-501. doi: 10.1109/EMBC.2012.6347239. Annu Int Conf IEEE Eng Med Biol Soc. 2012. PMID: 23367174 Review.
-
Stochastic models coupling gene expression and partitioning in cell division in Escherichia coli.Biosystems. 2020 Jun;193-194:104154. doi: 10.1016/j.biosystems.2020.104154. Epub 2020 Apr 28. Biosystems. 2020. PMID: 32353481 Review.
Cited by
-
Gene switching rate determines response to extrinsic perturbations in the self-activation transcriptional network motif.Sci Rep. 2016 Jun 3;6:26980. doi: 10.1038/srep26980. Sci Rep. 2016. PMID: 27256916 Free PMC article.
-
Automated identification and tracking of cells in Cytometry of Reaction Rate Constant (CRRC).PLoS One. 2023 Jul 3;18(7):e0282990. doi: 10.1371/journal.pone.0282990. eCollection 2023. PLoS One. 2023. PMID: 37399195 Free PMC article.
-
Non-genetic heterogeneity from stochastic partitioning at cell division.Nat Genet. 2011 Feb;43(2):95-100. doi: 10.1038/ng.729. Epub 2010 Dec 26. Nat Genet. 2011. PMID: 21186354 Free PMC article.
-
Coarse-grained analysis of stochastically simulated cell populations with a positive feedback genetic network architecture.J Math Biol. 2015 Jun;70(7):1457-84. doi: 10.1007/s00285-014-0799-2. Epub 2014 Jun 15. J Math Biol. 2015. PMID: 24929336
-
Modeling cell population dynamics.In Silico Biol. 2019;13(1-2):21-39. doi: 10.3233/ISB-180470. In Silico Biol. 2019. PMID: 30562900 Free PMC article.
References
-
- Delbrück, M. 1945. The burst size distribution in the growth of bacterial viruses (bacteriophages). J. Bacteriol. 50:131–135. - PubMed
-
- Powell, E. O. 1956. Growth rate and generation time of bacteria, with special reference to continuous culture. J. Gen. Microbiol. 15:492–511. - PubMed
-
- Baek, K., S. Svenningsen, H. Eisen, K. Sneppen, and S. Brown. 2003. Single-cell analysis of lambda immunity regulations. J. Mol. Biol. 334:363–372. - PubMed
-
- Ptashne, M. 1987. A Genetic Switch: Gene Control and Phage Lambda. Cell Press, Cambridge, MA, and Blackwell Science, Palo Alto, CA.
-
- Spudich, J. L., and D. E. Koshland. 1976. Non-genetic individuality: chance in the single cell. Nature. 262:467–476. - PubMed
Publication types
MeSH terms
Grants and funding
LinkOut - more resources
Full Text Sources
