. 2007 Apr 3;104(14):5889-94.
doi: 10.1073/pnas.0700337104. Epub 2007 Mar 23.

Elucidation of intracellular recycling pathways leading to exocytosis of the Fc receptor, FcRn, by using multifocal plane microscopy

Affiliations

Elucidation of intracellular recycling pathways leading to exocytosis of the Fc receptor, FcRn, by using multifocal plane microscopy

Prashant Prabhat et al. Proc Natl Acad Sci U S A. .

Abstract

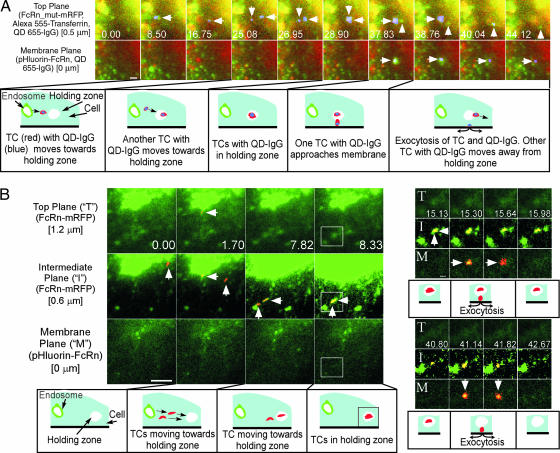
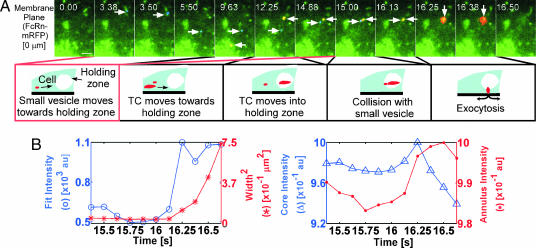
The intracellular events on the recycling pathway that lead from sorting endosomes to exocytosis at the plasma membrane are central to cellular function. However, despite intensive study, these processes are poorly characterized in spatial and dynamic terms. The primary reason for this is that, to date, it has not been possible to visualize rapidly moving intracellular compartments in three dimensions in cells. Here, we use a recently developed imaging setup in which multiple planes can be simultaneously imaged within the cell in conjunction with visualization of the plasma membrane plane by using total internal reflection fluorescence microscopy. This has allowed us to track and characterize intracellular events on the recycling pathway that lead to exocytosis of the MHC Class I-related receptor, FcRn. We observe both direct delivery of tubular and vesicular transport containers (TCs) from sorting endosomes to exocytic sites at the plasma membrane, and indirect pathways in which TCs that are not in proximity to sorting endosomes undergo exocytosis. TCs can also interact with different sorting endosomes before exocytosis. Our data provide insight into the intracellular events that precede exocytic fusion.


Conflict of interest statement

The authors declare no conflict of interest.

Figures

Fig. 1.
Fig. 1.
Partial exocytic fusion of a tubule extending from a sorting endosome. HMEC-1 cells cotransfected with pHluorin-FcRn and mRFP-FcRn were imaged. Individual images showing an area of interest of a cell are presented with the time (in seconds) at which each image was acquired (first image is arbitrarily set to time 0). FcRn is shown in green, and the events of interest are highlighted in red (resulting in yellow–orange overlay). A tubule (leftward arrows) extends from a sorting endosome in the intermediate plane (0.51–2.38 s) and approaches the plasma membrane (2.38–2.55 s, upward arrows). Partial fusion (upward arrow) is observed on the membrane plane (2.89 s) at the tip of this tubule while it appears to remain connected to the sorting endosome. Immediately after exocytosis, this tubule retracts toward the sorting endosome (3.23 s), subsequently detaches, and moves away from the sorting endosome. Images shown are individual frames of SI Movie 1. The images have been presented without highlighting and also as surface displays in SI Fig. 4 (with corresponding SI Movies 2 and 3, respectively). (Scale bar, 1 μm.)
Fig. 2.
Fig. 2.
TCs can migrate into “holding zones” before exocytosis. Individual images showing areas of interest of transfected HMEC-1 cells are presented with the time (in seconds) at which each image was acquired (first image is arbitrarily set to time 0). (A) Cells cotransfected with pHluorin-FcRn and FcRn_mut-mRFP (36) were incubated in medium (≈pH 7.3) with QD655-human IgG1 mutant [MST-HN (35)] complexes and Alexa Fluor 555-labeled transferrin before and during imaging. FcRn and transferrin (detected in the same channel) are indicated by green and QD-IgG complexes by red. The events of interest are highlighted in blue. An FcRn/transferrin-positive TC with IgG (leftward arrow) leaves a sorting endosome at 8.50 s. Later, another TC containing IgG (downward arrows) enters the same holding zone (28.90 s). One of the TCs exocytoses (38.76 s), releasing IgG (rightward arrows) on the membrane plane. The second TC (upward arrows) moves away from the holding zone in the top plane. The images have been presented as surface displays in SI Fig. 8A and B (with corresponding SI Movie 12). (Scale bar, 1 μm.) (B) HMEC-1 cells cotransfected with pHluorin-FcRn and FcRn-mRFP were imaged. FcRn is shown in green, and the events of interest are highlighted in red (resulting in yellow–orange overlay). A tubule (leftward arrows) leaves a sorting endosome (1.70 s) and enters a holding zone (7.82–8.33 s) in the intermediate plane in proximity to a second TC (upward arrows). One of the TCs fuses with the plasma membrane at 15.30–15.64 s (rightward arrows) and the second TC subsequently exocytoses at 41.14–41.82 s (downward arrows). Rectangles marked at 8.33 s are subsequently presented as cropped images. Focal planes marked as “T,” “I,” and “M” denote top plane, intermediate plane, and membrane plane, respectively, in the cropped images. Individual images in A and B are from SI Movies 11 and 13, respectively. The images have been presented without highlighting in SI Fig. 8C (with corresponding SI Movie 14). [Scale bars: 5 μm (Bottom Left) and 1 μm (Upper Right, in frame marked with “M”).]
Fig. 3.
Fig. 3.
Exocytosis of a TC can be preceded by interaction with a smaller vesicle. HMEC-1 cells cotransfected with FcRn-GFP and FcRn-mRFP were imaged. (A) Individual images showing area of interest of a cell are presented with the time (in seconds) at which each image was acquired (first image is arbitrarily set to time 0). FcRn is shown in green, and events of interest are highlighted in red (resulting in yellow–orange overlay) or blue. A small vesicle (highlighted in blue, rightward arrows) moves away from a tubule in the membrane plane (3.38–5.50 s) and then appears to be stationary for ≈7 s. A TC (highlighted in red, leftward arrows) moves ≈6 μm in the membrane plane (9.63–12.25 s) before becoming stationary (12.25–14.88 s). Subsequently, the vesicle (highlighted in blue) moves and appears to interact with the TC at 15.00 s. After this collision, the TC fuses (within ≈1 s) with the plasma membrane in an exocytic event (16.25–16.38 s, downward arrows), which lasts for ≈0.1 s. Images shown are individual frames of SI Movie 17. The images have been presented without highlighting in SI Fig. 10 (with corresponding SI Movie 18). (Scale bar, 2 μm.) (B) Quantitative analysis of the exocytic fusion event. (Left) The fit intensity width-square plot as a function of time. (Right) The core annulus intensity plot as a function of time for the same TC. SI Text, Section 6.3 describes further details of the analytical approaches used to analyze exocytic events.

References

    1. Steyer JA, Almers W. Nat Rev Mol Cell Biol. 2001;2:268–275. - PubMed
    1. Maxfield FR, McGraw TE. Nat Rev Mol Cell Biol. 2004;5:121–132. - PubMed
    1. Rodriguez-Boulan E, Kreitzer G, Musch A. Nat Rev Mol Cell Biol. 2005;6:233–247. - PubMed
    1. Axelrod D. In: Light Microscopy in Biology. Lacey AJ, editor. Oxford: Oxford Univ Press; 1999. pp. 399–423.
    1. Toomre D, Steyer JA, Keller P, Almers W, Simons K. J Cell Biol. 2000;149:33–40. - PMC - PubMed

Publication types

MeSH terms