. 2007 Mar;19(3):1081-95.
doi: 10.1105/tpc.106.045096. Epub 2007 Mar 23.

Death don't have no mercy and neither does calcium: Arabidopsis CYCLIC NUCLEOTIDE GATED CHANNEL2 and innate immunity

Affiliations

Death don't have no mercy and neither does calcium: Arabidopsis CYCLIC NUCLEOTIDE GATED CHANNEL2 and innate immunity

Rashid Ali et al. Plant Cell. 2007 Mar.

Abstract

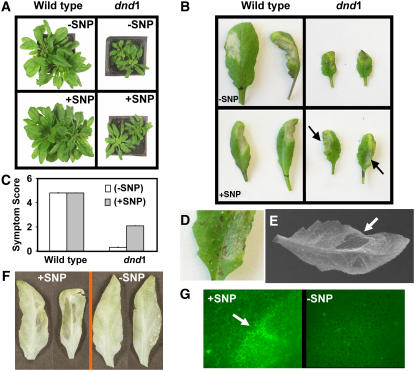
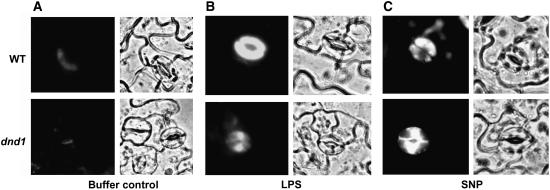
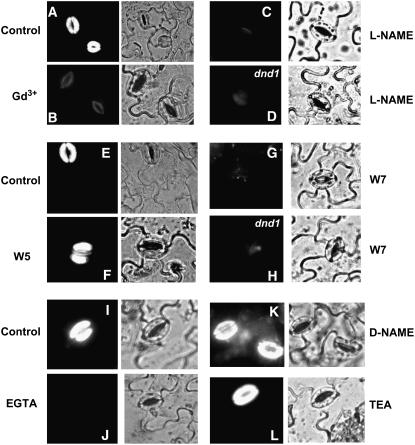
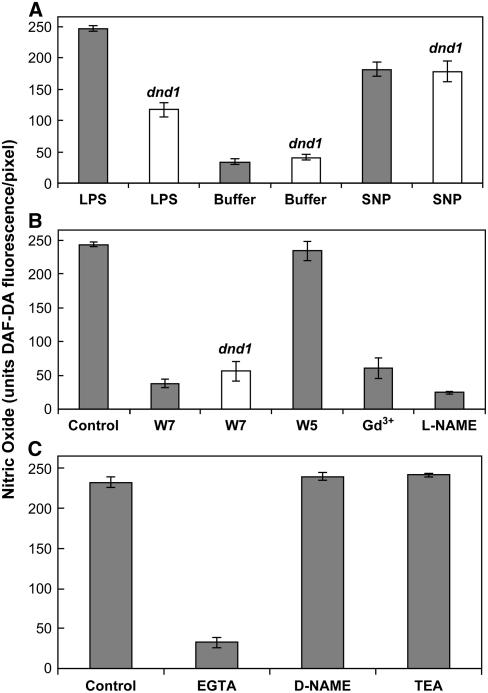
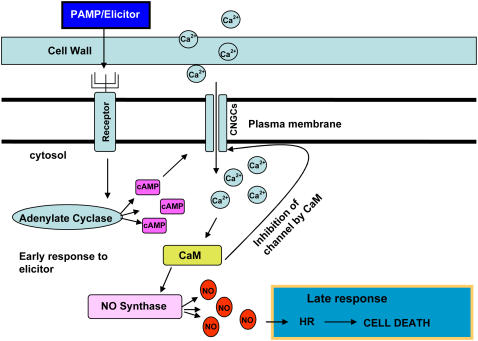
Plant innate immune response to pathogen infection includes an elegant signaling pathway leading to reactive oxygen species generation and resulting hypersensitive response (HR); localized programmed cell death in tissue surrounding the initial infection site limits pathogen spread. A veritable symphony of cytosolic signaling molecules (including Ca(2+), nitric oxide [NO], cyclic nucleotides, and calmodulin) have been suggested as early components of HR signaling. However, specific interactions among these cytosolic secondary messengers and their roles in the signal cascade are still unclear. Here, we report some aspects of how plants translate perception of a pathogen into a signal cascade leading to an innate immune response. We show that Arabidopsis thaliana CYCLIC NUCLEOTIDE GATED CHANNEL2 (CNGC2/DND1) conducts Ca(2+) into cells and provide a model linking this Ca(2+) current to downstream NO production. NO is a critical signaling molecule invoking plant innate immune response to pathogens. Plants without functional CNGC2 lack this cell membrane Ca(2+) current and do not display HR; providing the mutant with NO complements this phenotype. The bacterial pathogen-associated molecular pattern elicitor lipopolysaccharide activates a CNGC Ca(2+) current, which may be linked to NO generation due to buildup of cytosolic Ca(2+)/calmodulin.


Figures

Figure 1.
Figure 1.
Application of SNP Reverses the Lack of HR of dnd1 Plants to Infection with Avirulent Pathogen. (A) Application of SNP in the absence of pathogen had no effect on the wild-type or dnd1 plant phenotype. Wild-type Arabidopsis plants are shown on the left, and dnd1 plants are shown on the right. The top two panels show 8-week-old plants grown in the absence of SNP. The bottom two panels show plants grown as above for 6 weeks and then irrigated for 2 weeks with solutions containing 100 μM SNP. (B) Photographs of representative leaves detached from wild-type (left panels) and dnd1 (right panels) plants 24 h after inoculation with Pss. Plants were grown either in the absence (top panels) or presence (bottom panels; irrigation for 2 weeks as in [A]) of SNP. Arrows indicate necrotic regions of dnd1 leaves undergoing HR. (C) Quantitative scoring of HR in leaves of wild-type and dnd1 plants inoculated with Pss either in the absence (open bars) or presence (closed bars) of SNP. Results are presented as means of a minimum of 25 leaves per treatment ± se. (D) Enlarged image of a portion of a (+SNP) dnd1 leaf shown in the bottom right panel of (B) highlighting the region inoculated with Pss; note the flattened region undergoing tissue collapse. (E) A leaf (representative of three replicate treatments) from a dnd1 plant pretreated with SNP and inoculated with Pss. Leaves were removed from plants 48 h after treatment and bleached in ethanol. An arrow indicates the inoculated region, which appears more transparent and flattened compared with the rest of the leaf (also see leaves in [F]). This experiment was repeated a total of four times. Representative results from one of these experiments are shown in (A) to (D), and results from a different experiment are shown in (E). (F) Ethanol-bleached dnd1 leaves excised 9 h after inoculation with Pst avrRpt2+. Leaves shown in the left panel are from plants pretreated with SNP (as above); the panel on the right shows leaves from dnd1 plants treated with water. (G) Prior to ethanol bleaching, autofluorescence of leaves shown in (F) was evaluated as described by Balagué et al. (2003). The leaf shown in the left panel is from an SNP-pretreated plant; the leaf in the right panel is from a dnd1 plant treated with water. Regions at the edge of the inoculation zone are shown in both cases. We are aware that leaf veins display spontaneous autofluorescense; only interveinal regions are shown for +SNP and −SNP leaves. The arrow indicates autofluorescense occurring at the edge of the inoculation zone in dnd1 plants pretreated with SNP. A similar region of the inoculation zone was imaged for −SNP plants. Other experiments (data not shown) indicated that pretreatment of wild-type plants with SNP did not affect the HR response to Pst avrRpt2+ and that wild-type plants display no HR response to Pst avrRpt2.
Figure 2.
Figure 2.
LPS Activation of NO Generation in Wild-Type and dnd1 Guard Cells. Leaf epidermal peels prepared from wild-type (top panels) or dnd1 plants (bottom panels) were loaded with the NO-sensitive dye DAF-2DA prior to incubation in reaction buffer alone (buffer control) (A), 100 μg/mL LPS (B), or 50 μM SNP (C). In each case, corresponding fluorescence and bright-field images are shown; the area of the peel subjected to analysis was greater than that shown in each case. This experiment was repeated a total of three times. Representative cells from one of these experiments are shown. In each experiment, a minimum of three epidermal peels was used as treatment replicates (as was also done for the experiments shown in Figure 3).
Figure 3.
Figure 3.
The Signaling Pathway Leading from LPS Perception to NO Generation Involves Ca2+, CAM, and NOS. LPS activation of NO is blocked by chelation of extracellular Ca2+ with 2 mM EGTA (J) and by inhibitors of Ca2+ channels (100 μM Gd3+; [B]), Arg-dependent NOS (200 μM l-NAME; [C] and [D]), and CaM (50 μM W7; [G] and [H]). Also shown are results with the W7 analog W5 at 50 μM (F), the l-NAME isomer d-NAME at 200 μM (K), and the K+ channel blocker TEA at 10 mM (L). In all cases, DAF-2DA was loaded into cells of the epidermal peels and fluorescence was measured after addition of LPS. For each treatment, fluorescence and bright-field images are shown. Results from several experiments are compiled in this figure; controls (i.e., application of LPS alone to wild-type epidermal peels) for each experiment are shown in (A), (E), and (I). Results from epidermal peels prepared from wild-type ([A] to [C], [E] to [G], and [I] to [L]) and dnd1 ([D] and [H]) plants are shown. Experiments were repeated at least two times; representative images are shown.
Figure 4.
Figure 4.
Quantitative Analysis of in Vivo NO Generation Monitored Using DAF-2DA Fluorescence. The maximum fluorescence intensity that could be measured was 250 units/pixel (see Methods). Results shown are from three independent experiments. Results in (A) correspond to images shown in Figure 2; (B) and (C) correspond to images shown in Figure 3. In all cases, results are presented as mean (n ≥ 3) fluorescence intensity per pixel (i.e., averaged over the area of a guard cell pair; see Methods) ± se. In all cases, closed bars represent measurements taken on wild-type tissue; open bars denote measurements of epidermal peels prepared from dnd1 plants. The experiment shown in (A) compares fluorescence intensity of wild-type and dnd1 guard cells in reaction buffer alone (Buffer), reaction buffer with 100 μg/mL LPS added, or reaction buffer with 50 μM SNP added. For (B) and (C), all measurements were undertaken with 100 μg/mL LPS in the reaction solution. Measurements taken with LPS alone added to the reaction buffer are denoted as Control; for concentrations of other compounds added to the reaction buffer, see legends of Figures 2 and 3.
Figure 5.
Figure 5.
Coinfiltration of a CNGC Ca2+ Channel Blocker with Avirulent Pathogen Prevents HR in Wild-Type Arabidopsis. Leaves were inoculated with Pss (2 × 10⁸ colony-forming units/mL) alone (control) or Pss with 100 μM Gd3+. Photographs were taken after 19 h (top two panels), and then leaves were immersed in ethanol and photographed after 4 d (bottom two panels). Leaves shown are representative of at least three individual inoculations.
Figure 6.
Figure 6.
Patch Clamp Analysis Identifies a Cyclic Nucleotide Gated Ca2+ Channel in the Plasma Membrane of Guard Cell Protoplasts Prepared from Wild-Type Plants; This Current Is Absent from dnd1 Guard Cell Protoplasts. (A) Current/voltage relationships from voltage ramp command protocols recorded in the whole-cell configuration are shown for representative wild-type (left panel) and dnd1 (right panel) guard cell protoplasts. Current traces from voltage ramps prior to (−db-cAMP; gray current traces) and after (+db-cAMP; black current traces) addition of 1 mM db-cAMP to the perfusion bath are shown. The time period between addition of db-cAMP to the perfusion bath solution and initiation of the voltage ramp shown is noted in parentheses. As described in an earlier publication (Lemtiri-Chlieh and Berkowitz, 2004), this inward Ba2+ current is present in wild-type protoplasts in the absence of exogenously added cAMP (e.g., note the flickery channel opening events recorded in the absence of ligand at ∼−140 to −160 mV); we speculate that sufficient endogenous cyclic nucleotide may be present in the cell to activate some of the channels present in the membrane. However, when the channel is present in the plasma membrane, we note that adding cyclic nucleotide (at levels used here) always increases the magnitude of the whole-cell current, as is shown here in the case of wild-type protoplasts (Lemtiri-Chlieh and Berkowitz, 2004). Coincident with the dwarf phenotype of dnd1 plants (Figure 1A) and smaller leaves of the mutant (Figure 1B), we anecdotally note that dnd1 guard cell protoplasts are smaller than wild-type cells and are extremely difficult to patch. When forming giga-ohm seals with dnd1 guard cells, the protoplast often is sucked up into the patch pipette. We successfully patched three dnd1 guard cells (from three different protoplast preparations) for long enough time periods to allow for db-cAMP addition and incubation of the protoplast in activating ligand for >15 min; the recording shown is representative of these three experiments. In all three cases, application of db-cAMP did not increase the inward Ba2+ current (see [B]). We observed cyclic nucleotide activation of current in wild-type guard cells in 13 of 15 cells tested. (B) Calculated mean current at various step voltages (±se) for dnd1 guard cells in the absence (squares) and presence (circles) of 1 mM db-cAMP (n = 3 in both cases). The calculated current/voltage relationship does not appear rectified and reverses at ∼0 mV, suggesting that leak current may contribute significantly to the measured values in dnd1 cells. However, note that the calculated current at each voltage does not appear to be affected by addition of db-cAMP in these cells.
Figure 7.
Figure 7.
LPS Effects on a Ca2+-Conducting Channel Recorded in the Whole-Cell Configuration from Wild-Type Arabidopsis Guard Cell Protoplasts. (A) Recordings were made at various command potentials (as indicated to the right of the current traces in millivolts) in the absence (Control; left panel) or (at a minimum of) 15 min after addition of 100 μg/mL LPS to the perfusion bath solution (LPS; right panel). Note the single channel events recorded from the guard cell in the absence of LPS. Vertical and horizontal bars represent current and time scales, respectively. Results shown are from one protoplast. Similar results were obtained from a total of three protoplasts in three independent experiments. In the absence of LPS addition to the perfusion bath, the currents recorded at hyperpolarizing voltages did not decrease over the time period used for this experiment (data not shown). (B) Ramp recordings measured prior to (Control) and >15 min after addition of LPS to the perfusion bath. Ramp currents were recorded from the same protoplast used for the recordings in (A). (C) Current/voltage relationship generated from the single channel events recorded in the absence of LPS from the experiment shown in (A). Means (±se) of single channel events recorded at various command potentials are shown. The Nernst equilibrium potential for Ba2+ (EBa) corrected for ionic activity is +41.5 mV; note that the reversal potential calculated for the current (+36 mV) is close to EBa and far away from EK (−75 mV) and ECl (−25 mV), indicating that LPS is inhibiting a Ca2+-conducting channel.
Figure 8.
Figure 8.
LPS Activates an Inwardly Rectified Ca2+ Channel in Guard Cell Protoplasts Preincubated with the CaM Antagonist W7. Voltage ramps recorded in the whole-cell configuration are shown. Studies were done with wild-type Arabidopsis (A) or V. faba (B) guard cell protoplasts. (A) Recordings were made in standard perfusion buffer (see Methods) (trace 1), with 50 μM W7 added (trace 2), and after addition of 100 μg/mL LPS and 50 μM W7 to the perfusion bath (trace 3). Trace 1 was recorded prior to addition of W7. For the W7 + LPS treatment (trace 3), the protoplast was preincubated for >20 min in W7 prior to adding LPS to the perfusion bath. (B) Voltage ramps recorded from a V. faba guard cell protoplast under similar conditions (traces 1 to 3) as described above (A) for Arabidopsis. In this experiment, a ramp recording was also made in the presence of W7, LPS, and 50 μM Gd3+ (trace 4). Recordings were made from three different V. faba protoplasts; representative results from one cell are shown.
Figure 9.
Figure 9.
Model of Proposed Early Events in Plant Innate Immune Response/HR to Avirulent Pathogen and/or LPS. (1) The presence of an extracellular PAMP/elicitor is recognized by an (unknown) receptor in the plant cell plasma membrane. (2) Pathogen/PAMP elicitor recognition by a receptor activates CNGC2 current (either by an increase in cytosolic level of activating ligand through the upregulation of a nucleotide triphosphate cyclase or by some other unknown mechanism). (3) Activation of inward CNGC2 current results in a (transient) increase in cytosolic Ca2+. (4) Cytosolic Ca2+/CaM level increases due to influx of Ca2+ into the cell. (5) Ca2+/CaM rise in cytosol inhibits CNGC2, ending the transient cytosolic Ca2+ spike. (6) Ca2+/CaM rise activates NOS, leading to an increase in NO generation. (7) NO generation, in concert with other required factors (e.g., presence of the avirulent pathogen), can lead to HR, innate immunity signaling, and, perhaps, diffusion of a signal (NO) to neighboring cells that could result in further CNGC activation (NO is thought to enhance plant cell cytosolic nucleotide triphosphate cyclase activity).

References

    1. Abramoff, M.D., Magelhaes, P.J., and Ram, S.J. (2004). Image processing with ImageJ. Biophotonics International 11 36–42.
    1. Ali, R., Zielinski, R., and Berkowitz, G.A. (2006). Expression of plant cyclic nucleotide-gated cation channels in yeast. J. Exp. Bot. 57 125–138. - PubMed
    1. Balagué, C., Lin, B., Alcon, C., Flottes, G., Malmström, S., Köhler, C., Neuhaus, G., Pelletier, G., Gaymard, F., and Roby, D. (2003). HLM1, and essential signaling component in the hypersensitive response, is a member of the cyclic nucleotide-gated channel ion channel family. Plant Cell 15 365–379. - PMC - PubMed
    1. Bindschedler, L.V., Minibayeva, F., Gardner, S.L., Gerrish, C., Davies, D.R., and Bolwell, G.P. (2001). Early signalling events in the apoplastic oxidative burst in suspension cultured French bean cells involve cAMP and Ca2+. New Phytol. 151 185–194. - PubMed
    1. Bouché, N., Yellin, A., Snedden, W.A., and Fromm, H. (2005). Plant-specific calmodulin-binding proteins. Annu. Rev. Plant Biol. 56 435–466. - PubMed

Publication types

MeSH terms