Evaluation of the Cepheid GeneXpert BCR-ABL assay
- PMID: 17384214
- PMCID: PMC1867453
- DOI: 10.2353/jmoldx.2007.060112
Evaluation of the Cepheid GeneXpert BCR-ABL assay
Abstract
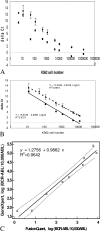
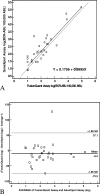
Patients with chronic myeloid leukemia harbor the chromosomal translocation t(9;22), which corresponds to fusion of the BCR and ABL genes at the DNA level. The translated fusion product is an oncogenic protein with increased ABL tyrosine kinase activity causing cell transformation. To date, reverse transcriptase-polymerase chain reaction is considered the most sensitive method available for detecting low copy numbers of the BCR-ABL gene fusion. Recently, Cepheid introduced its GeneXpert-based assay for the identification of the BCR-ABL gene fusion in cells from blood samples. This system comprises a walk-away self-contained instrument that combines cartridge-based microfluidic sample preparation with reverse transcriptase-polymerase chain reaction-based fluorescent signal detection and BCR-ABL and ABL Ct (threshold cycle) determination. The difference between the BCR-ABL Ct and ABL Ct (DeltaCt) is expected to represent the ratio of the two populations of mRNAs and ultimately the percentage of neoplastic cells present. We tested whether this BCR-ABL fusion detection system could be used as a clinical diagnostic tool for monitoring patients with minimal residual disease of chronic myelogenous leukemia. We report similar performance characteristics, including limit of detection, specificity, sensitivity, and precision, of this automated BCR-ABL fusion detection system to those of a manual TaqMan reverse transcriptase-polymerase chain reaction-based test.
Figures


Similar articles
-
Real-time quantitative reverse transcriptase polymerase chain reaction.Methods Mol Biol. 2010;630:199-213. doi: 10.1007/978-1-60761-629-0_13. Methods Mol Biol. 2010. PMID: 20300999
-
Rapid quantitative detection of BCR-ABL transcripts in chronic myeloid leukemia patients by real-time reverse transcriptase polymerase-chain reaction using fluorescently labeled probes.Haematologica. 2000 Dec;85(12):1248-54. Haematologica. 2000. PMID: 11114130
-
Sensitive detection and quantification of minimal residual disease in chronic myeloid leukaemia using nested quantitative PCR for BCR-ABL DNA.Int J Lab Hematol. 2010 Dec;32(6 Pt 1):e222-8. doi: 10.1111/j.1751-553X.2010.01236.x. Int J Lab Hematol. 2010. PMID: 20491997
-
[New approach in the diagnosis and monitoring of treatment in chronic myelogenous leukemia].Orv Hetil. 2004 Dec 26;145(52):2603-9. Orv Hetil. 2004. PMID: 15724695 Review. Hungarian.
-
[Ten years of molecular monitoring of chronic myeloid leukemia by quantitative RT-PCR].Cas Lek Cesk. 2005;144(1):32-7. Cas Lek Cesk. 2005. PMID: 15789779 Review. Czech.
Cited by
-
Validation Strategy for Ultrasensitive Mutation Detection.Mol Diagn Ther. 2018 Oct;22(5):603-611. doi: 10.1007/s40291-018-0350-z. Mol Diagn Ther. 2018. PMID: 29974360
-
A longitudinal evaluation of performance of automated BCR-ABL1 quantitation using cartridge-based detection system.Pathology. 2015 Oct;47(6):570-4. doi: 10.1097/PAT.0000000000000293. Pathology. 2015. PMID: 26166664 Free PMC article.
-
Precision Medicine in Low- and Middle-Income Countries.Annu Rev Pathol. 2022 Jan 24;17:387-402. doi: 10.1146/annurev-pathol-042320-034052. Annu Rev Pathol. 2022. PMID: 35073168 Free PMC article. Review.
-
Current developments in molecular monitoring in chronic myeloid leukemia.Ther Adv Hematol. 2016 Oct;7(5):237-251. doi: 10.1177/2040620716657994. Epub 2016 Jul 15. Ther Adv Hematol. 2016. PMID: 27695615 Free PMC article. Review.
-
Precursor B cell lymphoid blast crisis of chronic myeloid leukemia with novel chromosomal abnormalities: A case report.Oncol Lett. 2018 Nov;16(5):6691-6696. doi: 10.3892/ol.2018.9497. Epub 2018 Sep 25. Oncol Lett. 2018. PMID: 30405810 Free PMC article.
References
-
- Druker BJ, Tamura S, Buchdunger E, Ohno S, Segal GM, Fanning S, Zimmermann J, Lydon NB. Effects of a selective inhibitor of the Abl tyrosine kinase on the growth of Bcr-Abl positive cells. Nat Med. 1996;2:561–566. - PubMed
-
- Butturini A, Klein J, Gale RP. Modeling minimal residual disease (MRD)-testing. Leuk Res. 2003;27:293–300. - PubMed
-
- Tefferi A, Dewald GW, Litzow ML, Cortes J, Mauro MJ, Talpaz M, Kantarjian HM. Chronic myeloid leukemia: current application of cytogenetics and molecular testing for diagnosis and treatment. Mayo Clin Proc. 2005;80:390–402. - PubMed
-
- Gutterman JU, Mavligit G, Burgess MA, McCredie KB, Hunter C, Freireich EJ, Hersh EM. Immunodiagnosis of acute leukemia: detection of residual disease. J Natl Cancer Inst. 1974;53:389–392. - PubMed
Publication types
MeSH terms
Substances
LinkOut - more resources
Full Text Sources
Other Literature Sources
Medical
Miscellaneous

