

Assessment of the frequency of allelic imbalance in human tissue using a multiplex polymerase chain reaction system
- PMID: 17384220
- PMCID: PMC1867446
- DOI: 10.2353/jmoldx.2007.060115
Assessment of the frequency of allelic imbalance in human tissue using a multiplex polymerase chain reaction system
Abstract
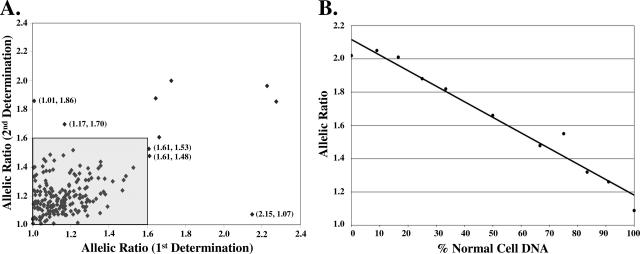
Genomic instability can generate chromosome breakage and fusion randomly throughout the genome, frequently resulting in allelic imbalance, a deviation from the normal 1:1 ratio of maternal and paternal alleles. Allelic imbalance reflects the karyotypic complexity of the cancer genome. Therefore, it is reasonable to speculate that tissues with more sites of allelic imbalance have a greater likelihood of having disruption of any of the numerous critical genes that cause a cancerous phenotype and thus may have diagnostic or prognostic significance. For this reason, it is desirable to develop a robust method to assess the frequency of allelic imbalance in any tissue. To address this need, we designed an economical and high-throughput method, based on the Applied Biosystems AmpFlSTR Identifiler multiplex polymerase chain reaction system, to evaluate allelic imbalance at 16 unlinked, microsatellite loci located throughout the genome. This method provides a quantitative comparison of the extent of allelic imbalance between samples that can be applied to a variety of frozen and archival tissues. The method does not require matched normal tissue, requires little DNA (the equivalent of approximately 150 cells) and uses commercially available reagents, instrumentation, and analysis software. Greater than 99% of tissue specimens with >or=2 unbalanced loci were cancerous.
Figures


Similar articles
-
Thymidylate synthetase allelic imbalance in clear cell renal carcinoma.Cancer Chemother Pharmacol. 2009 Nov;64(6):1195-200. doi: 10.1007/s00280-009-0986-9. Epub 2009 Mar 22. Cancer Chemother Pharmacol. 2009. PMID: 19306093
-
Allelic alterations at the STR markers in the buccal tissue cells of oral cancer patients and the oral epithelial cells of healthy betel quid-chewers: an evaluation of forensic applicability.Forensic Sci Int. 2002 Oct 9;129(3):158-67. doi: 10.1016/s0379-0738(02)00205-0. Forensic Sci Int. 2002. PMID: 12372686
-
Analytical and statistical methods to evaluate microsatellite allelic imbalance in small amounts of DNA.Lab Invest. 2004 May;84(5):649-57. doi: 10.1038/labinvest.3700076. Lab Invest. 2004. PMID: 15048133
-
Principle and applications of digital PCR.Expert Rev Mol Diagn. 2004 Jan;4(1):41-7. doi: 10.1586/14737159.4.1.41. Expert Rev Mol Diagn. 2004. PMID: 14711348 Review.
-
Mapping genetic alterations in tumors with single nucleotide polymorphisms.Curr Opin Oncol. 2003 Jan;15(1):50-4. doi: 10.1097/00001622-200301000-00007. Curr Opin Oncol. 2003. PMID: 12490761 Review.
Cited by
-
Malignant tumors and forensics--dilemmas and proposals.Croat Med J. 2009 Jun;50(3):218-27. doi: 10.3325/cmj.2009.50.218. Croat Med J. 2009. PMID: 19480018 Free PMC article.
-
High frequency of microsatellite instability and its substantial co-existence with KRAS and BRAF mutations in Vietnamese patients with colorectal cancer.Oncol Lett. 2021 Jan;21(1):41. doi: 10.3892/ol.2020.12302. Epub 2020 Nov 13. Oncol Lett. 2021. PMID: 33262833 Free PMC article.
-
Genomic instability demonstrates similarity between DCIS and invasive carcinomas.Breast Cancer Res Treat. 2009 Sep;117(1):17-24. doi: 10.1007/s10549-008-0165-4. Epub 2008 Sep 11. Breast Cancer Res Treat. 2009. PMID: 18785004 Free PMC article.
References
-
- Lengauer C, Kinzler KW, Vogelstein B. Genetic instabilities in human cancers. Nature. 1998;396:643–649. - PubMed
-
- Payne SR, Kemp CJ. Tumor suppressor genetics. Carcinogenesis. 2005;26:2031–2045. - PubMed
-
- Hanahan D, Weinberg RA. The hallmarks of cancer. Cell. 2000;100:57–70. - PubMed
-
- Mundle SD, Sokolova I. Clinical implications of advanced molecular cytogenetics in cancer. Expert Rev Mol Diagn. 2004;4:71–81. - PubMed
-
- Gray JW, Collins C. Genome changes and gene expression in human solid tumors. Carcinogenesis. 2000;21:443–452. - PubMed
Publication types
MeSH terms
Substances
Grants and funding
LinkOut - more resources
Full Text Sources
Other Literature Sources
Medical
