. 2007 Apr;16(4):671-82.
doi: 10.1110/ps.062504907.

A combined structural dynamics approach identifies a putative switch in factor VIIa employed by tissue factor to initiate blood coagulation

Affiliations

A combined structural dynamics approach identifies a putative switch in factor VIIa employed by tissue factor to initiate blood coagulation

Ole H Olsen et al. Protein Sci. 2007 Apr.

Abstract

Coagulation factor VIIa (FVIIa) requires tissue factor (TF) to attain full catalytic competency and to initiate blood coagulation. In this study, the mechanism by which TF allosterically activates FVIIa is investigated by a structural dynamics approach that combines molecular dynamics (MD) simulations and hydrogen/deuterium exchange (HX) mass spectrometry on free and TF-bound FVIIa. The differences in conformational dynamics from MD simulations are shown to be confined to regions of FVIIa observed to undergo structural stabilization as judged by HX experiments, especially implicating activation loop 3 (residues 365-374{216-225}) of the so-called activation domain and the 170-loop (residues 313-322{170A-175}) succeeding the TF-binding helix. The latter finding is corroborated by experiments demonstrating rapid deglycosylation of Asn322 in free FVIIa by PNGase F but almost complete protection in the presence of TF or an active-site inhibitor. Based on MD simulations, a key switch of the TF-induced structural changes is identified as the interacting pair Leu305{163} and Phe374{225} in FVIIa, whose mutual conformations are guided by the presence of TF and observed to be closely linked to the structural stability of activation loop 3. Altogether, our findings strongly support an allosteric activation mechanism initiated by the stabilization of the Leu305{163}/Phe374{225} pair, which, in turn, stabilizes activation loop 3 and the S(1) and S(3) substrate pockets, the activation pocket, and N-terminal insertion.


Figures
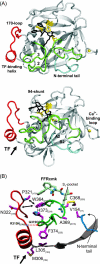
Figure 1.
Figure 1.
(A) The twin β-barrel structure of the protease domain of FVIIa from two orientations. The following regions are shown in color: (red) the TF-binding helix and the 170-loop; (yellow) the catalytic triad; (black) the covalently bound inhibitor FFR-cmk; (green) activation loops 1–3; and (blue)the N-terminal tail. The activation loops and the N-terminal tail constitute the so-called activation domain. The β-strands A2 and B2, the Ca2+-binding loop, as well as the 94-shunt are indicated. The direction from which TF interacts with FVIIa is denoted by an arrow. (B) TF-responsive regions of the FVIIa protease domain. Regions include the TF interaction region, active-site region, and the cavity for N-terminal insertion (activation pocket). The coloring scheme from A is applied with the TF-binding helix (residues 306–312{164–170}) and the adjacent 170-loop (residues 313–322{170A-175}) shown in red and activation loop 3 (residues 365–374{216–225}) in green. Activation loop 2 (residues 331–342{184A-193}) is omitted for clarity. The active-site inhibitor FFRcmk is present to illustrate the active-site region but was not included in any of the simulations. The numbers in subscript denote the chymotrypsin numbering. The structure of FVIIa was obtained from the 1DAN PDB entry (Banner et al. 1996) and is shown from the orientation in subsequent figures.
Figure 2.
Figure 2.
Conformational flexibility of FVIIa during MD simulation. Isotropic fluctuations, Δ, of backbone atoms in the protease domain of free (red dots) and TF-complexed FVIIa (black lines) are plotted versus residue number. The isotropic fluctuations were calculated from average structures within each nanosecond interval. The activation loops are specified (black arrows). The mean amplitude of vibrations, Ui, was calculated from crystallographic B-factors, Bi, from the relation Ui = Bi ½/(2 × 2½π) and is plotted in green. B-factors were taken from 1DAN.PDB (Banner et al. 1996).
Figure 3.
Figure 3.
Overview of results from MD and SMD simulations. RMSDs versus time (relative to the initial structures) for the protease domain of (A,B) free FVIIa and (C,D) TF-bound FVIIa. RMSDs in black are calculated for the protease domain, while the RMSDs in red are calculated exclusively for the activation loops 1 (residues 285–294{142–152}), 2 (residues 331–342{184A-193}), and 3 (residues 365–374{216–225}). In A and C, the N terminus is in the activation pocket, while it has been extracted from the pocket in B and D during the first 1.5 nsec of the simulation using the SMD approach, described in Materials and Methods. Snapshots (from 10 nsec to 12 nsec in intervals of 0.1 nsec) of structures along trajectories for free FVIIa from (E) MD and (F) SMD: (yellow) N terminus; (purple) activation loops; and (blue) the 170-loop.
Figure 4.
Figure 4.
Structural dynamics of the 170-loop monitored by distances between side-chain atoms in the protease domain versus time for (A,B) free FVIIa and (C,D) FVIIa complexed to TF. The simulated structures were heated for 0.5 nsec prior to time t = 0. (Black) Distance from Trp364{215}CH2 to Pro321{170I}CG; (red) Trp364{215}CH2 to Asn322{175}; (green) Arg315{170C}N to Gly372{223}CO; and (blue) Ile153{16}N to Asp343{194}CG. The latter distance is measured to follow the position of the N terminus. A and C show the distances when the N terminus is residing in the activation pocket during the simulations, while in B and D, the N terminus is extracted during the first 1.5 nsec of simulations using the SMD approach. After the 1.5 nsec of SMD simulation, the simulations are continued in a conventional MD approach. (E) HX curves, fitted to a triexponential model by linear least squares regression as described in Materials and Methods, are shown of peptide 314–325{170B-178}, comprising the 170-loop in the presence (red triangles) or absence (blue triangles) of TF. (F) Representative HPLC traces of free FVIIa at 0, 18, and 90 min. HC/LC and HC*/LC* represent glycosylated and deglycosylated heavy chain/light chain, respectively. (G) Time courses for protease domain deglycosylation of 3 μM FVIIa by 50 U/μL PNGase F at pH 7.0 and 30°C were recorded for the free form (circles), in the presence of 6 μM sTF (squares), or with a covalent EGR-cmk inhibitor occupying the active-site (triangles).
Figure 5.
Figure 5.
Dynamic interplay between the TF-binding region and activation loop 3. Side-chain torsion angle χ2 plotted versus χ1 every 0.5 psec for Leu305{163} and Phe374{225} of (A,B) free FVIIa and (C,D) FVIIa in complex with TF. (Black) Data extracted from MD simulations; (red) data from the SMD simulations. Asterisks indicate the χ1, χ2 angles as observed in the X-ray structure of the FVIIa–sTF complex. In A, a side chain in the MD simulations rotates after 3 nsec and 7 nsec of simulation (black arrows) to attain new conformations, while in B, a rotation of the side chain occurs after 7 nsec of simulation (black arrow). In C, an intermittent rotation occurs during MD simulations after 14.5 nsec (black arrows) that is persistent for 1 nsec. During the SMD simulation, a switch to another side-chain orientation is seen after 16 nsec and is persisting for 0.5 nsec. It should be noted that the dense cloud of data points at (−77, 180) in A and C corresponds to a rotated conformation of the isopropyl of Leu305{163} that places its methyl group in close contact with the phenyl ring of Phe374{225} as observed in the X-ray structure. In E and F, snapshots are shown of the conformations of Leu305{163} and Phe374{225} in the MD simulation after 6 nsec and 14 nsec, respectively (side chains in blue and activation loops 2 and 3 in gray). The conformation in the X-ray structure of the FVIIa–sTF complex is overlaid for comparison (side chains in purple and activation loops 2 and 3 in green). (G) HX curves, fitted to a triexponential model by linear least squares regression as described in Materials and Methods, are shown of peptides 361–369{212–221A} and 371–377{222–228} comprising activation loop 3. Data points and the HX curves of FVIIa and FVIIa–TF are displayed in diamonds with blue and red curves, respectively. The fitted parameters of peptide 371–377{222–228} are N fast = 0.3, k fast = 20 sec−1, N intermediate = 1.3, k intermediate = 0.1 sec−1, N slow = 2, k slow = 5 × 10⁻⁴ sec−1 for free FVIIa; and N fast = 0.4, k fast = 20 sec−1, N intermediate = 1.2, k intermediate = 3 × 10⁻² sec−1, N slow = 6, k slow = 1.4 × 10⁻⁴ sec−1 for TF-bound FVIIa. Fitted parameters of peptide 361–369{212–221A} are identical for both FVIIa and TF-bound FVIIa and are not shown for clarity.

Similar articles

Cited by

References

    1. Anand G.S., Law, D., Mandell, J.G., Snead, A.N., Tsigelny, I., Taylor, S.S., Eyck, L.F.T., and Komives, E.A. 2003. Identification of the protein kinase A regulatory RIα-catalytic subunit interface by amide H/2H exchange and protein docking. Proc. Natl. Acad. Sci. 100: 13264–13269. - PMC - PubMed
    1. Bai Y., Milne, J.S., Mayne, L., and Englander, S.W. 1993. Primary structure effects on peptide group hydrogen exchange. Proteins 17: 75–86. - PMC - PubMed
    1. Bajaj S.P., Schmidt, A.E., Agah, S., Bajaj, M.S., and Padmanabhan, K. 2006. High resolution structures of p-aminobenzamidine- and benzamidine-VIIa/soluble tissue factor: Unpredicted conformation of the 192–193 peptide bond and mapping of Ca2+, Mg2+, Na+ and Zn2+ sites in factor VIIa. J. Biol. Chem. 281: 24873–24888. - PubMed
    1. Banner D.W., D'Arcy, A., Chène, C., Winkler, F.K., Guha, A., Konigsberg, W.H., Nemerson, Y., and Kirchhofer, D. 1996. The crystal structure of the complex of blood coagulation factor VIIa with soluble tissue factor. Nature 380: 41–46. - PubMed
    1. Davie E.W., Fujikawa, K., and Kisiel, W. 1991. The coagulation cascade: Initiation, maintenance, and regulation. Biochemistry 30: 10363–10370. - PubMed

LinkOut - more resources