. 2007 Apr;13(4):423-31.
doi: 10.1038/nm1564. Epub 2007 Mar 25.

Myelin-specific regulatory T cells accumulate in the CNS but fail to control autoimmune inflammation

Affiliations

Myelin-specific regulatory T cells accumulate in the CNS but fail to control autoimmune inflammation

Thomas Korn et al. Nat Med. 2007 Apr.

Abstract

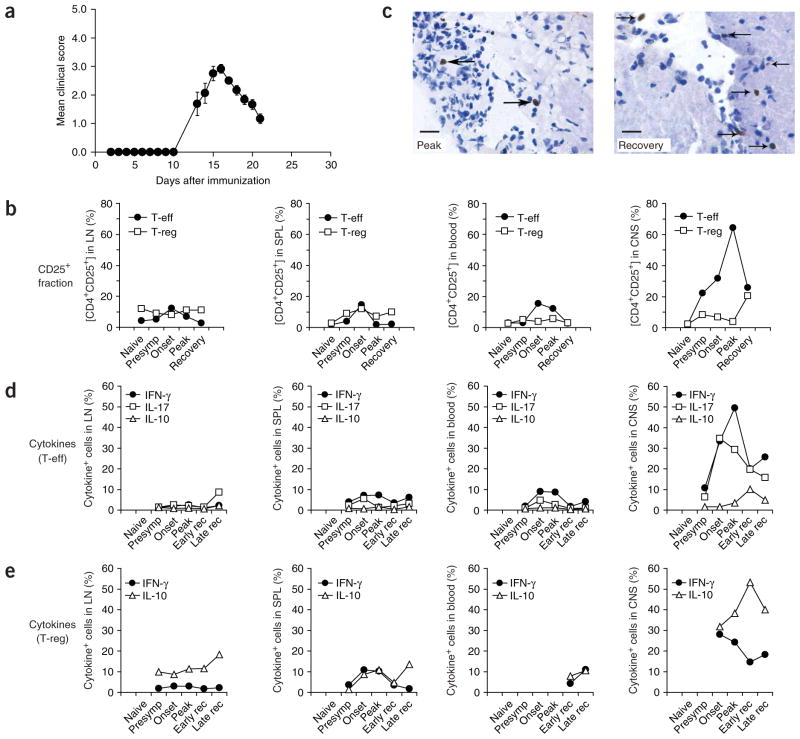
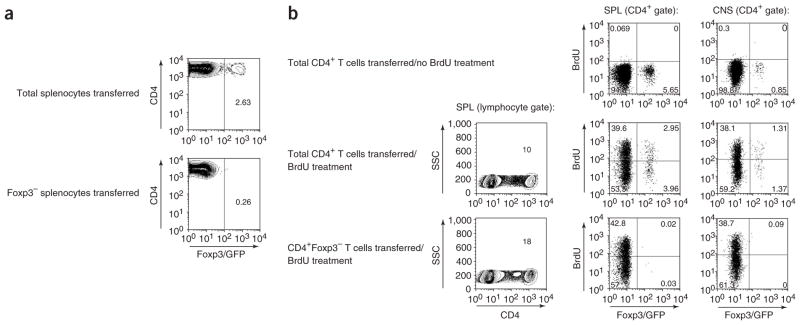
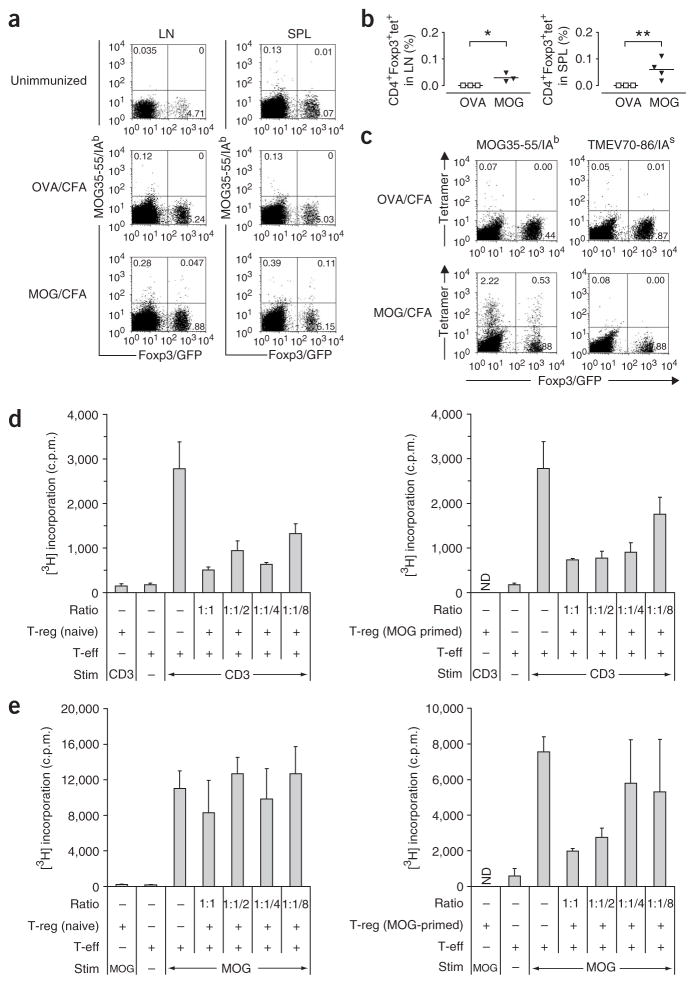
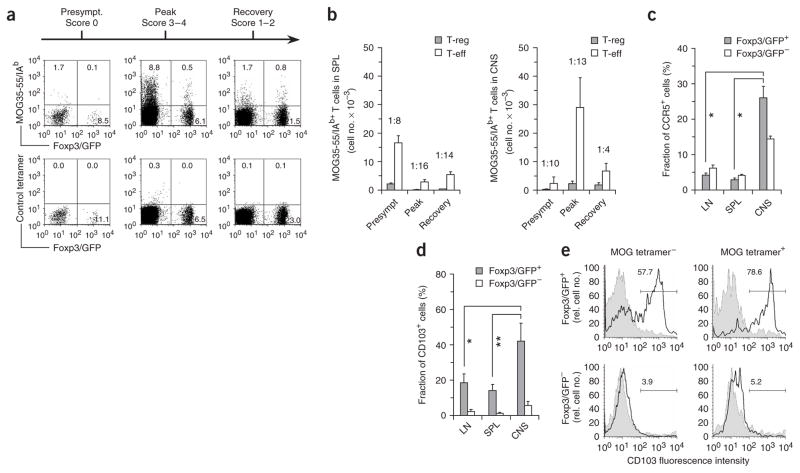
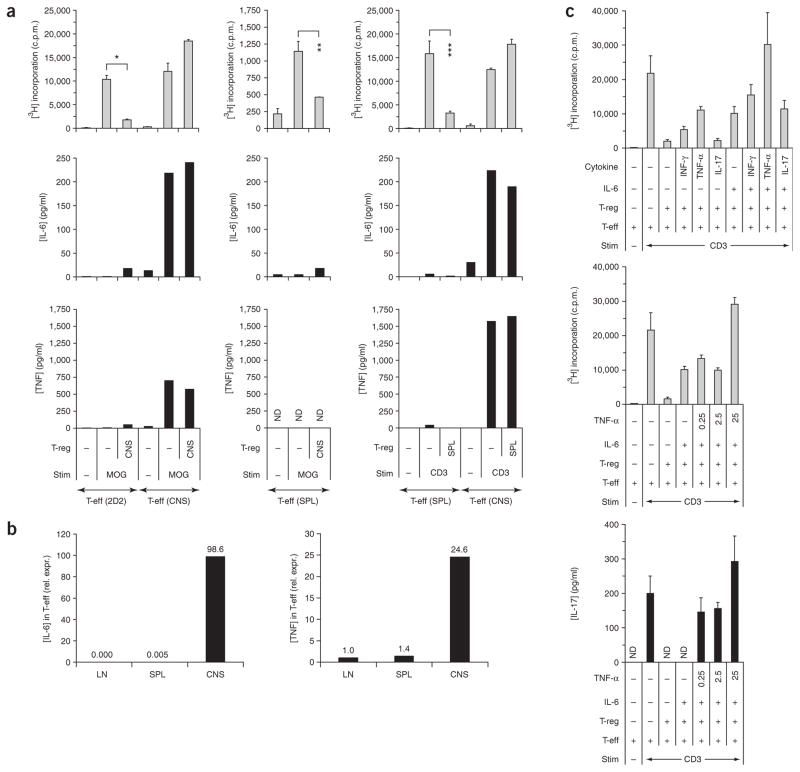
Treatment with ex vivo-generated regulatory T cells (T-reg) has been regarded as a potentially attractive therapeutic approach for autoimmune diseases. However, the dynamics and function of T-reg in autoimmunity are not well understood. Thus, we developed Foxp3gfp knock-in (Foxp3gfp.KI) mice and myelin oligodendrocyte glycoprotein (MOG)(35-55)/IA(b) (MHC class II) tetramers to track autoantigen-specific effector T cells (T-eff) and T-reg in vivo during experimental autoimmune encephalomyelitis (EAE), an animal model for multiple sclerosis. MOG tetramer-reactive, Foxp3(+) T-reg expanded in the peripheral lymphoid compartment and readily accumulated in the central nervous system (CNS), but did not prevent the onset of disease. Foxp3(+) T cells isolated from the CNS were effective in suppressing naive MOG-specific T cells, but failed to control CNS-derived encephalitogenic T-eff that secreted interleukin (IL)-6 and tumor necrosis factor (TNF). Our data suggest that in order for CD4(+)Foxp3(+) T-reg to effectively control autoimmune reactions in the target organ, it may also be necessary to control tissue inflammation.


Conflict of interest statement

COMPETING INTERESTS STATEMENT

The authors declare no competing financial interests.

Figures

Figure 1
Figure 1
T-reg infiltrate the CNS during EAE. (a) EAE was induced in Foxp3gfp.KI mice by immunization with MOG35–55 in complete Freund adjuvant (CFA). The course of EAE in these mice is shown as mean clinical score (± s.e.m., n = 8). (b) T-eff and T-reg population dynamics in the draining lymph nodes (LN), spleen (SPL), blood and the CNS at different stages of EAE. Mononuclear cells were prepared and analyzed by flow cytometry. CD4+Foxp3/GFP (T-eff) and CD4+Foxp3/GFP+ (T-reg) are shown according to their expression level of CD25. (c) Immunohistochemical analysis of Foxp3+ cells (arrows) in inflammatory foci in a mouse at the peak of disease (left) and during recovery (right). Scale bars, 15 μm. (d,e) Mononuclear cells were isolated from LN, SPL, blood and the CNS, activated with phorbol 12-myristate 13-acetate (PMA)/ionomycin, and stained for intracellular cytokines. Data represent the percentage of cytokine+ cells within the T-eff population (CD4+Foxp3/GFP) (d) and the T-reg population (CD4+Foxp3/GFP+) (e) at different phases of the disease.
Figure 2
Figure 2
Foxp3/GFP T cells are not converted into T-reg during EAE. (a) Total splenocytes or 5 × 10⁶ FACS-purified Foxp3/GFP splenocytes from CD45.2 Foxp3gfp.KI donor mice were transferred intravenously (i.v.) into CD45.1 congenic hosts. After 1 d, the recipient mice were immunized with MOG35–55/CFA. After 6 d, draining lymph node cells were isolated and analyzed for Foxp3/GFP expression in the CD4+ T-cell population positive for the donor-specific marker CD45.2. Numbers indicate percentages within the CD4+CD45.2+ gate. (b) We transferred 10 × 106 total CD4+ T cells or 5 × 10⁶ FACS-sorted CD4+Foxp3/GFP T cells from naive Foxp3gfp.KI donor mice intraperitoneally (i.p.) into Rag2−/− recipients. After 5 d, the recipients were immunized with MOG/CFA. Starting from day 9 after immunization, the mice were treated with 2 mg BrdU i.p. every other day up to a cumulative dose of 8 mg BrdU as indicated. Eight hours after the last BrdU injection, CD4+ T cells recovered from the spleen and the CNS were analyzed by flow cytometry for the expression of Foxp3/GFP and the incorporation of BrdU. Representative flow cytometric analyses, which indicate percentages of BrdU+ cells in the corresponding gates, are shown for one individual mouse of each group. Each group consisted of two or three mice. Two independent experiments were performed.
Figure 3
Figure 3
Antigen-specific T-reg are expanded upon immunization with MOG35–55 and can be triggered by MOG35–55 to suppress T-eff responses. (a) Lymph node cells and splenocytes were isolated from unimmunized Foxp3gfp.KI mice or from Foxp3gfp.KI mice that had been in vivo–sensitized with OVA323–339/CFA or MOG35–55/CFA 8 d earlier. The cells were stained ex vivo with MOG35–55/IAb tetramers. Live (7AAD) CD4+ T-cell populations are shown. The numbers in each quadrant represent percentages. (b) MOG tetramers detected a significant population of myelin-specific T-reg in the draining lymph nodes (*P < 0.05) and spleens (**P < 0.03) of MOG-immunized, but not OVA-immunized, mice. (c) After short-term culture of splenocytes in the presence of the immunizing antigen, MOG-specific T-eff and T-reg were visualized by MOG35–55/IAb tetramer staining. (d) CD4+Foxp3/GFP+ T-reg isolated by FACS sorting from the spleens of naive or MOG35–55-immunized mice were tested for their suppressive capacity in vitro. A fixed number of naive 2D2 responder T cells (CD4+CD62L+CD25) was cultured with titrated numbers of T-reg in the presence of irradiated syngeneic splenocytes as antigen-presenting cells (APCs) and a monoclonal antibody to CD3. (e) In an analogous assay, naive and MOG-primed T-reg were compared for their capacity to suppress MOG35–55-specific recall responses. Mean [3H]thymidine incorporation indicated as c.p.m. (+ s.d.) in triplicate wells. The ratios indicated in d and e represent the ratios of T-eff:T-reg. ND, not done.
Figure 4
Figure 4
Myelin-specific T-reg accumulate in the CNS. Mononuclear cells were prepared from the CNS of MOG/CFA-immunized mice at different stages of EAE as indicated. (a) CD4+ T cells stained with MOG35–55/IAb tetramer or a control-tetramer. The numbers indicate percentages within the CD4+ T-cell gate. (b) Absolute numbers of MOG tetramer–positive T-reg versus T-eff recovered from the spleen (SPL) and the CNS before disease onset (Presympt), at the peak of disease and during recovery. The ratio of MOG-specific T-reg:T-eff is indicated for each disease phase. (c) Comparison of CCR5 expression on CD4+Foxp3/GFP+ T cells (T-reg) and CD4+Foxp3/GFP T cells (T-eff) isolated from the lymph nodes (LN), spleen (SPL) and CNS of EAE mice at the peak of disease (day 14). Mean (+ s.d.) of isotype-controlled expression of CCR5. n = 3. *P < 0.004, t-test. (d) CD103 (integrin αEβ7) expression on T-reg (CD4+Foxp3/GFP+) versus T-eff (CD4+Foxp3/GFP) at the peak of disease. Mean (+ s.d.) of isotype-controlled expression of CD103. n = 4–7. *P < 0.003, **P < 0.002, t-test. (e) CD103+ cells are enriched in MOG tetramer–positive T-reg. Three-color staining for CD4, MOG tetramer and CD103 in CNS mononuclear cells from EAE mice. The fraction (as a percentage) of CD103+ cells (black line) versus control IgG (shaded curve) is shown in the MOG tetramer–negative and MOG tetramer–positive T-reg (top) and T-eff (bottom) populations.
Figure 5
Figure 5
T-eff isolated from the acutely inflamed CNS are not suppressible by T-reg. Mononuclear cells from the spleen and the CNS of EAE mice were isolated at the peak of disease and FACS sorted for CD4+Foxp3/GFP (T-eff) and CD4+Foxp3/GFP+ (T-reg). (a) The T-reg populations were tested in MOG-specific suppression assays and in suppression assays driven by antibody to CD3 in a 1:1 ratio with naive MOG TcR-transgenic T cells (2D2) or with CNS-T-eff or splenic T-eff from EAE mice as indicated. The proliferation of responder cells was measured by 3[H]thymidine incorporation. Mean of triplicate assays (+ s.d.). *P < 2 × 10⁻⁹, **P < 3 × 10⁻⁴, ***P < 0.008, t-test. Supernatants were taken after 48 h and the cytokines IL-6 and TNF were analyzed by cytometric bead array. (b) Cytokine expression in T-eff from lymph nodes (LN), spleen (SPL) and the CNS at the peak of disease (day 14). Mononuclear cells were isolated as described and FACS purified based on the T-eff phenotype (CD4+Foxp3/GFP). cDNA was prepared and quantitative PCR was performed for IL-6 and TNF. One of two independent EAE experiments. (c) The combination of IL-6 and TNF-α induced a complete block in T-reg–mediated inhibition of T-eff from unimmunized mice. CD4+Foxp3/GFP+ T-reg were isolated from naive Foxp3gfp.KI mice and tested in a ratio of 1:1 for suppression of CD4+Foxp3/GFP T-eff from unimmunized Foxp3gfp.KI mice upon polyclonal stimulation with antibody to CD3. Cytokines were added at a concentration of 25 ng/ml or titrated as indicated (in ng/ml). Proliferation was determined as 3[H]thymidine incorporation. Mean (+ s.d.) of triplicate cultures. Supernatants were collected after 48 h and assessed for IL-17 by ELISA (ND, not detectable).

Comment in

References

    1. Sakaguchi S. Naturally arising Foxp3-expressing CD25+CD4+ regulatory T cells in immunological tolerance to self and non-self. Nat Immunol. 2005;6:345–352. - PubMed
    1. Kim JM, Rasmussen JP, Rudensky AY. Regulatory T cells prevent catastrophic autoimmunity throughout the lifespan of mice. Nat Immunol. 2007;8:191–197. - PubMed
    1. Reddy J, et al. Myelin proteolipid protein-specific CD4+CD25+ regulatory cells mediate genetic resistance to experimental autoimmune encephalomyelitis. Proc Natl Acad Sci USA. 2004;101:15434–15439. - PMC - PubMed
    1. Kohm AP, Carpentier PA, Anger HA, Miller SD. Cutting edge: CD4+CD25+ regulatory T cells suppress antigen-specific autoreactive immune responses and central nervous system inflammation during active experimental autoimmune encephalomyelitis. J Immunol. 2002;169:4712–4716. - PubMed
    1. Herman AE, Freeman GJ, Mathis D, Benoist C. CD4+CD25+ T regulatory cells dependent on ICOS promote regulation of effector cells in the prediabetic lesion. J Exp Med. 2004;199:1479–1489. - PMC - PubMed

Publication types

MeSH terms

Substances