

Mercury exposure from domestic and imported estuarine and marine fish in the U.S. seafood market
- PMID: 17384771
- PMCID: PMC1817718
- DOI: 10.1289/ehp.9377
Mercury exposure from domestic and imported estuarine and marine fish in the U.S. seafood market
Abstract
Background: Methylmercury exposure causes a variety of adverse effects on human health. Per capita estimates of mercury exposure are critical for risk assessments and for developing effective risk management strategies.
Objective: This study investigated the impact of natural stochasticity in mercury concentrations among fish and shellfish harvested from the Atlantic Ocean, Pacific Ocean, and foreign shores on estimated mercury exposures.
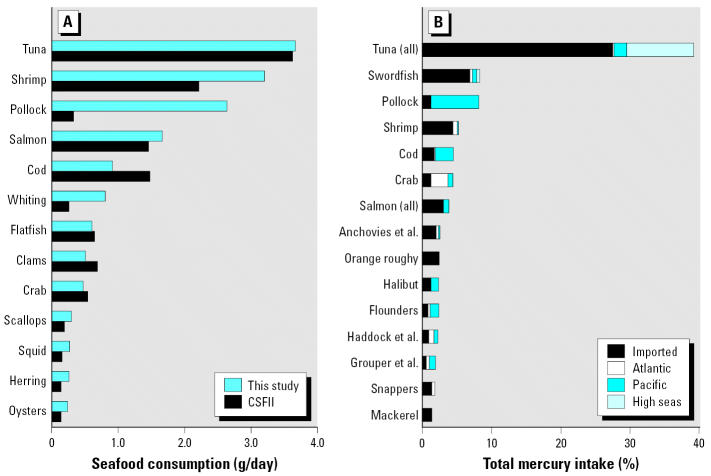
Methods: Mercury concentrations and seafood consumption are grouped by supply region (Atlantic Ocean, Pacific Ocean, and foreign shores). Distributions of intakes from this study are compared with values obtained using national FDA (Food and Drug Administration) mercury survey data to assess the significance of geographic variability in mercury concentrations on exposure estimates.
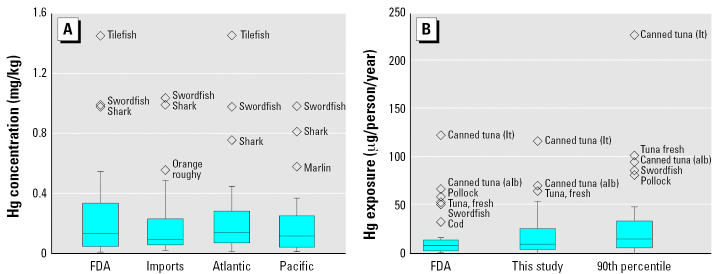
Results: Per capita mercury intake rates calculated using FDA mercury data differ significantly from those based on mercury concentration data for each supply area and intakes calculated for the 90th percentile of mercury concentrations.
Conclusions: Differences in reported mercury concentrations can significantly affect per capita mercury intake estimates, pointing to the importance of spatially refined mercury concentration data. This analysis shows that national exposure estimates are most influenced by reported concentrations in imported tuna, swordfish, and shrimp; Pacific pollock; and Atlantic crabs. Collecting additional mercury concentration data for these seafood categories would improve the accuracy of national exposure estimates.
Figures
Similar articles
-
Ranking the contributions of commercial fish and shellfish varieties to mercury exposure in the United States: implications for risk communication.Environ Res. 2010 Apr;110(3):226-36. doi: 10.1016/j.envres.2009.12.006. Epub 2010 Feb 8. Environ Res. 2010. PMID: 20116785
-
Exposure assessment for methyl and total mercury from seafood consumption in Korea, 2005 to 2008.J Environ Monit. 2011 Sep;13(9):2400-5. doi: 10.1039/c1em10504c. Epub 2011 Aug 16. J Environ Monit. 2011. PMID: 21847486
-
Mercury in fish available in supermarkets in Illinois: are there regional differences.Sci Total Environ. 2006 Aug 31;367(2-3):1010-6. doi: 10.1016/j.scitotenv.2006.04.018. Epub 2006 Jul 3. Sci Total Environ. 2006. PMID: 16815532
-
Shellfish and residual chemical contaminants: hazards, monitoring, and health risk assessment along French coasts.Rev Environ Contam Toxicol. 2011;213:55-111. doi: 10.1007/978-1-4419-9860-6_3. Rev Environ Contam Toxicol. 2011. PMID: 21541848 Review.
-
A quantitative synthesis of mercury in commercial seafood and implications for exposure in the United States.Environ Health Perspect. 2012 Nov;120(11):1512-9. doi: 10.1289/ehp.1205122. Epub 2012 Jun 25. Environ Health Perspect. 2012. PMID: 22732656 Free PMC article. Review.
Cited by
-
Human exposure to methylmercury from crayfish (Procambarus clarkii) in China.Environ Geochem Health. 2016 Feb;38(1):169-81. doi: 10.1007/s10653-015-9701-4. Epub 2015 Apr 8. Environ Geochem Health. 2016. PMID: 25850898
-
Comparing nearshore benthic and pelagic prey as mercury sources to lake fish: the importance of prey quality and mercury content.Sci Total Environ. 2016 Sep 15;565:211-221. doi: 10.1016/j.scitotenv.2016.04.162. Epub 2016 May 9. Sci Total Environ. 2016. PMID: 27173839 Free PMC article.
-
Fish consumption and mercury exposure among Louisiana recreational anglers.Environ Health Perspect. 2011 Feb;119(2):245-51. doi: 10.1289/ehp.1002609. Epub 2010 Oct 27. Environ Health Perspect. 2011. PMID: 20980220 Free PMC article.
-
An experimental study of the impacts of solar radiation and temperature on mercury emission from different natural soils across China.Environ Monit Assess. 2019 Aug 7;191(9):545. doi: 10.1007/s10661-019-7717-4. Environ Monit Assess. 2019. PMID: 31392424
-
Mercury content of blue crabs (Callinectes sapidus) from southern New England coastal habitats: Contamination in an emergent fishery and risks to human consumers.Mar Pollut Bull. 2018 Jan;126:166-178. doi: 10.1016/j.marpolbul.2017.10.089. Epub 2017 Nov 9. Mar Pollut Bull. 2018. PMID: 29421084 Free PMC article.
References
-
- Adams DH. Total mercury levels in tunas from offshore waters of the Florida Atlantic coast. Mar Pollut Bull. 2004;49(7–8):659–663. - PubMed
-
- Al-Saleh I, Al-Doush Mercury content in shrimp and fish species from the Gulf coast of Saudi Arabia. Bull Environ Contam Toxicol. 2002;68:576–583. - PubMed
-
- Andersen JL, Depledge MH. A survey of total and methylmercury in edible fish and invertebrates from Azorean Waters. Mar Environ Res. 1997;44(3):331–350.
-
- Atuna 2006. Tuna Species Datasheet. Available: http://www.atuna.com/species/species_index.htm [accessed 1 October 2006].
-
- Bacci E. Mercury in the Mediterranean. Mar Pollut Bull. 1989;20:59–63.
MeSH terms
Substances
LinkOut - more resources
Full Text Sources
Medical
