. 2007 May;236(5):1161-74.
doi: 10.1002/dvdy.21115.

Fibroblast growth factor-hedgehog interdependence during retina regeneration

Affiliations

Fibroblast growth factor-hedgehog interdependence during retina regeneration

Jason R Spence et al. Dev Dyn. 2007 May.

Abstract

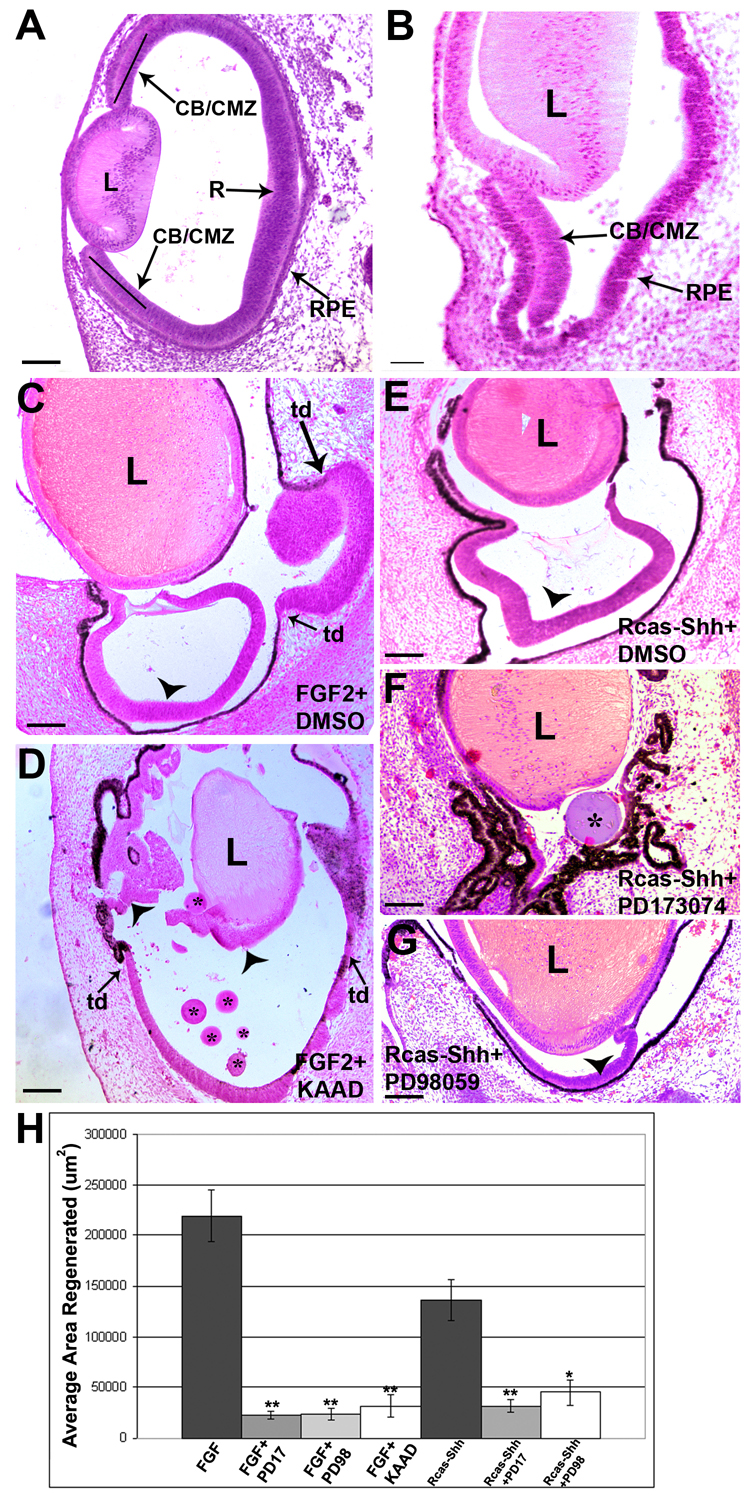
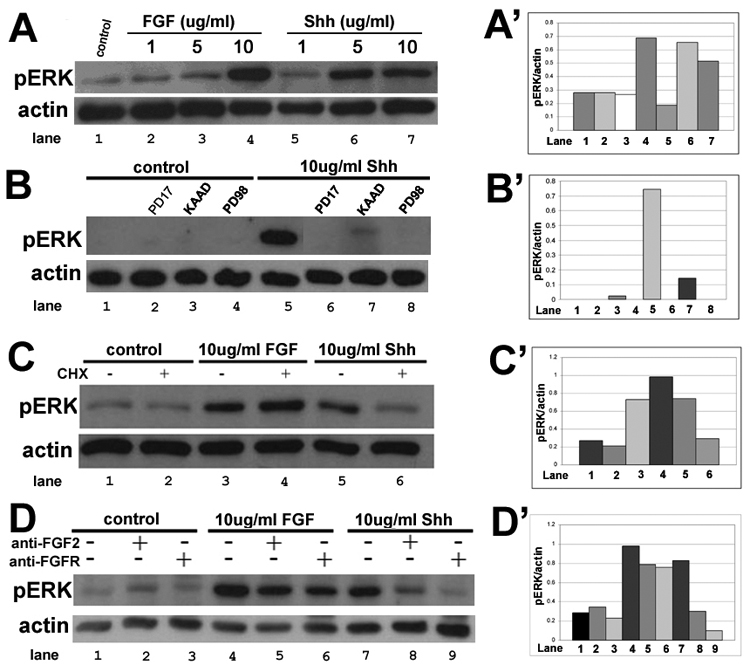
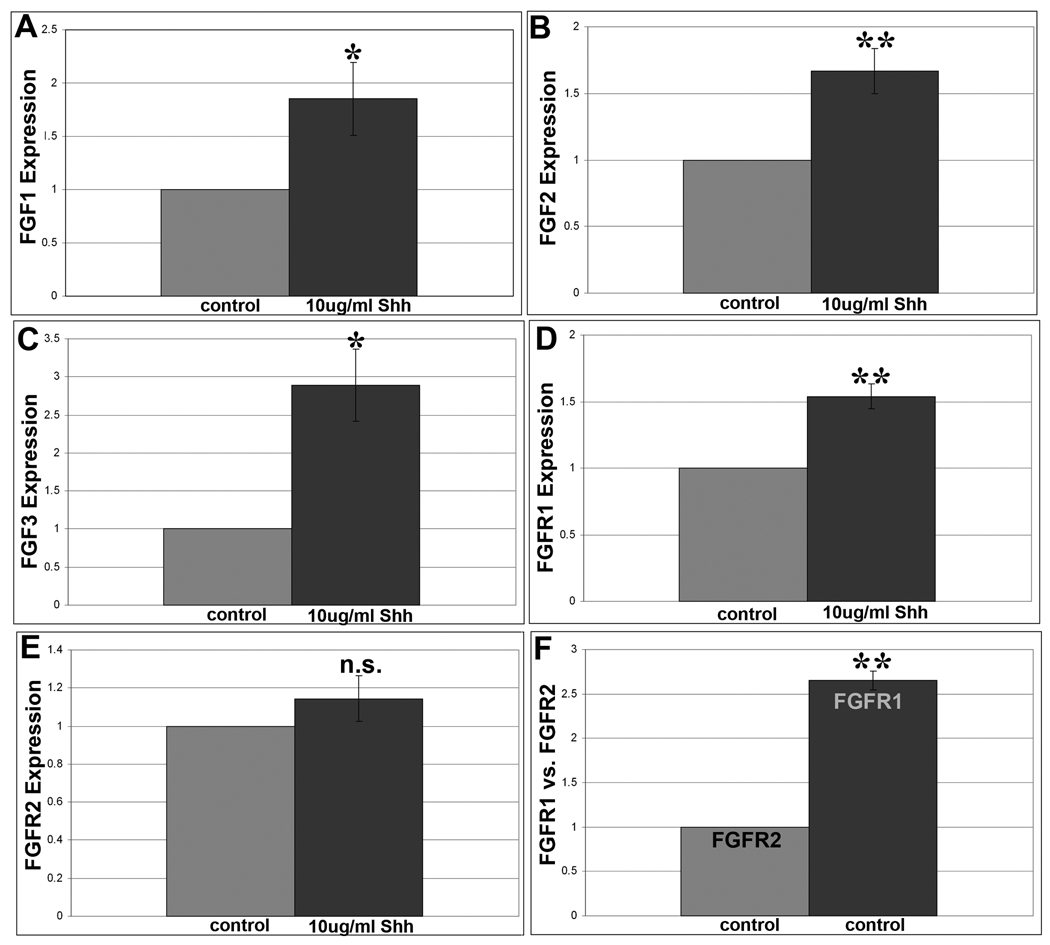
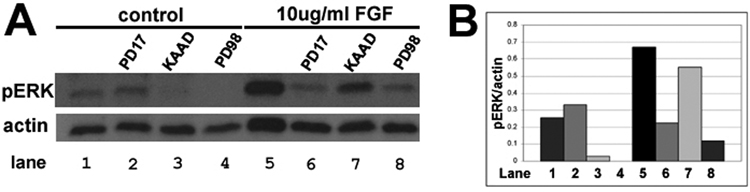
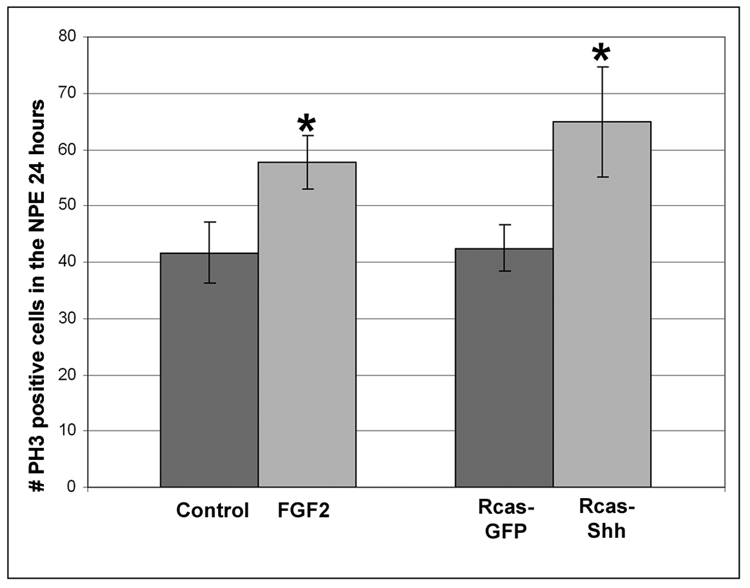
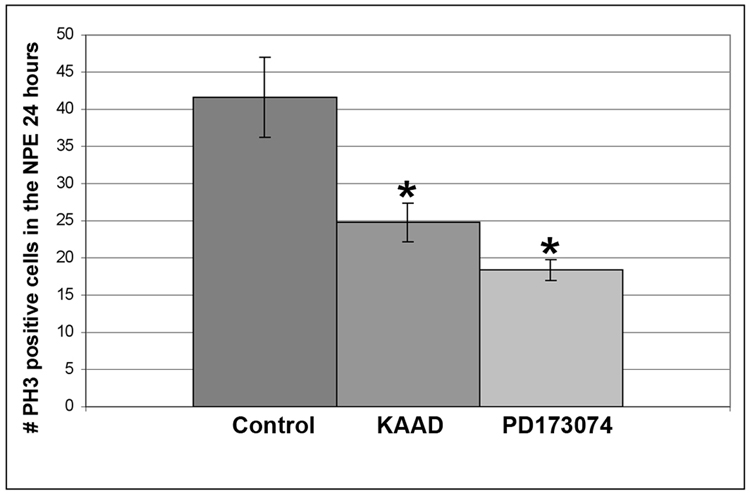
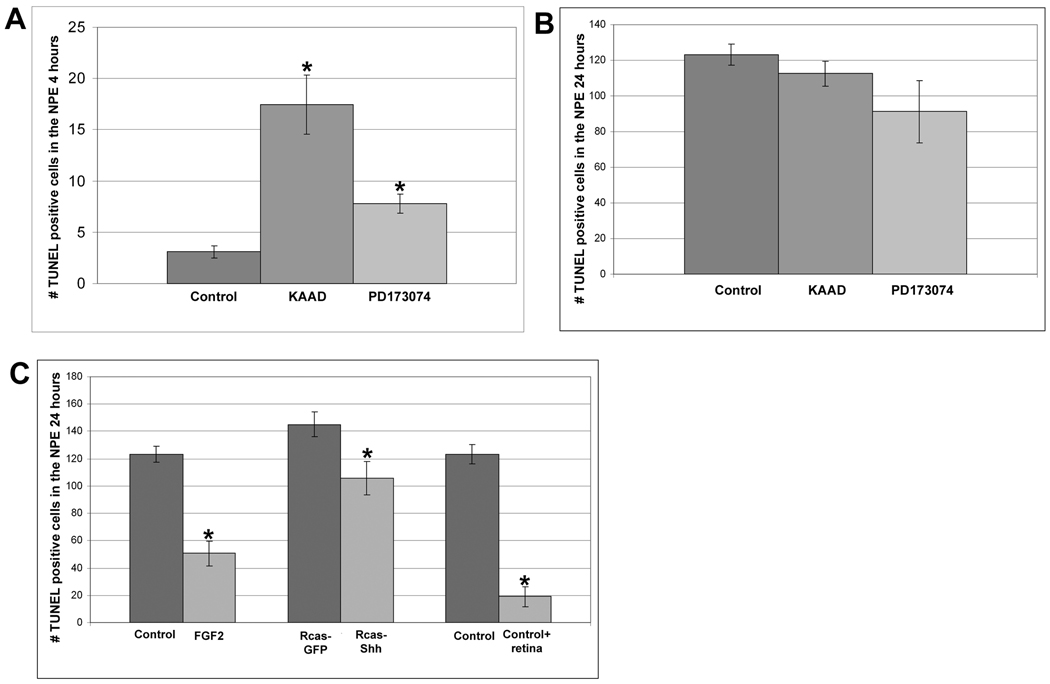
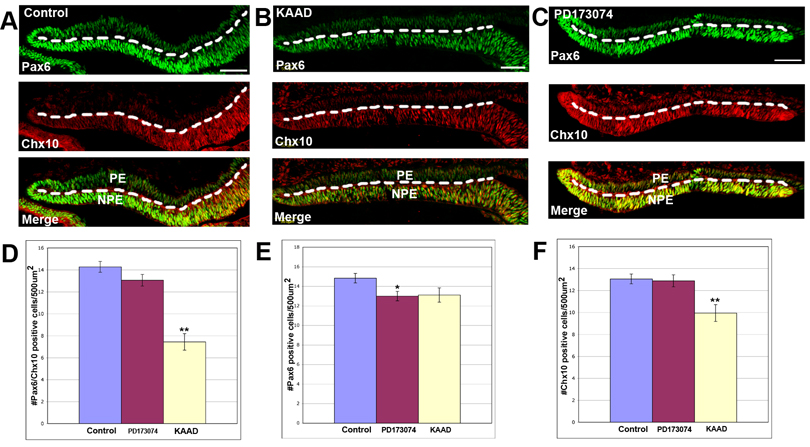
The embryonic chick is able to regenerate the retina after it has been removed. We have previously shown that proliferating stem/progenitor cells present in the ciliary body/ciliary marginal zone (CB/CMZ) of the chick eye are responsible for regeneration, which can be induced by ectopic fibroblast growth factor-2 (FGF2) or Sonic hedgehog (Shh). Here, we reveal the mechanisms showing how FGF2 and Shh signaling are interdependent during retina regeneration. If the FGF pathway is inhibited, regeneration stimulated by Shh is inhibited. Likewise, if the Hedgehog pathway is inhibited, regeneration stimulated by FGF2 is inhibited. We examined early signaling events in the CB/CMZ and found that FGF2 or Shh induced a robust Erk phosphorylation during the early stages of retina regeneration. Shh also up-regulated the expression of several members of the FGF signaling pathway. We show that ectopic FGF2 or Shh overexpression increased the number of phosphohistone 3 (PH3)-positive cells in the CB/CMZ and inhibition of either pathway decreased the number of PH3-positive cells. Additionally, both FGF and Hh signaling are required for cell survival in the CB/CMZ, whereas Hh and not FGF signaling plays a role in maintaining the identity of the retinal progenitor population in this region. Combined, our results support a model where the FGF and Hedgehog pathways work together to stimulate retina regeneration.


Figures

Figure 1
Figure 1. FGF and Hh signaling are required for retina regeneration in vivo
A. A histological section of an E4 chick eye at the stage at which retinectomies were performed. B. E4 chick eye after the retina has been removed, leaving behind only the CB/CMZ, lens (L) and RPE. Note that the RPE is not heavily pigmented at this stage and has thickened. C. E7 chick eye, 3 days after retinectomy and addition of FGF2 plus a control bead soaked in DMSO. In FGF2 treated eyes, regeneration from the CB/CMZ (arrowhead) and transdifferentiation (td) of the RPE can be observed. D. Inhibiting the Hh pathway with beads soaked in 200uM KAAD decreases retina regeneration from the CB/CMZ (arrowheads) when stimulated with FGF2, 3 days after retina removal. Asterisks denote KAAD soaked beads. Note the arrowhead near the lens points to regeneration from the CB/CMZ that is closely associated with the lens. Transdifferentiating retina is denoted by (td) and arrows. E. E7 chick eye, 3 days after retinectomy and addition of Rcas-Shh plus a control bead soaked in DMSO. Only regeneration from the CB/CMZ (arrowhead) can be observed. F. Inhibition of the FGF receptors with beads soaked in 100mM PD173074 inhibits regeneration stimulated by Rcas-Shh, 3 days after retina removal. Asterisk denotes PD173074 soaked bead. G. Inhibition of MEK with beads soaked in 100mM PD98059 decreases Rcas-Shh stimulated regeneration from the CB/CMZ (arrowhead) 3 days after retina removal. Scale bars in all panels represent 100um. R=retina; RPE=retina pigmented epithelium; L= lens; CB/CMZ= ciliary body/ciliary marginal zone; td= trans-differentiation. H. The areas of regenerated retinal tissue from all treated eyes was traced and quantified using ImagePro as described under materials and methods. These quantitative results support the represenatative images shown in C–G. Error bars are S.E.M. * = p<0.05, ** = p<0.01.
Figure 2
Figure 2. Early signaling events in the CB/CMZ show an intimate connection between FGF and Shh signaling pathways
A. E4 CB/CMZ explants were used as either untreated tissue (control; lane 1), or tissue exposed to 1, 5 or 10 ug/ml of FGF2 (lane 2, 3, 4) or 1, 5 or 10ug/ml Shh peptide (lane 5, 6, 7). Explants were assayed for pErk using Western blot analysis. Actin was used as a loading control to show that similar amounts of protein were run in each lane. 10ug/ml of FGF2 and 5 and 10ug/ml of Shh were able to induce robust Erk phosphorylation. A’. Densitometry showing the ratio of pErk/actin in A. B. pErk levels were assayed in untreated E4 CB/CMZ explants (control; lane 1) or in E4 explants that were exposed to either FGFR inhibitor PD173074 (lane 2), Hh pathway inhibitor KAAD (lane 3) or MEK inhibitor PD98059 (lane 4). Explants were also exposed to 10ug/ml Shh alone (lane 5) or with PD173074 (lane 6), KAAD (lane 7) or PD98059 (lane 8). Shh was able to induce robust pErk levels, and this was abolished by inhibiting FGF/MAPK signaling or Hh signaling. B’. Densitometry showing the ratio of pErk/actin in B. C. E4 untreated CB/CMZ explants were used as control (lanes 1, 2). E4 explants were treated with 10ug/ml FGF2 (lanes 3, 4) or 10ug/ml Shh peptide (lanes 5, 6) for 4 hours. One hour prior to addition of growth factors, 100ug/ml of cycloheximide (CHX) was added. CHX did not decrease the amount of pErk in FGF2 treated explants (lane 3 vs. lane 4), but inhibited Erk phosphorylation in Shh treated explants (lane 5 vs. lane 6). C’. Densitometry showing the ratio of pErk/actin in C. D. E4 untreated CB/CMZ explants were used as control (lanes 1–3). E4 explants were treated with 10ug/ml FGF2 (lanes 3, 4) or 10ug/ml Shh (lanes 5, 6) for 4 hours. One hour prior to addition of growth factors, anti-FGFR or anti-FGF2 was added to the culture media at a dilution of 1:10. Both anti-FGF2 and anti-FGFR inhibited Erk phosphorylation stimulated by FGF2 (lanes 4–6) as well as Erk phosphorylation stimulated by Shh (lanes 7–9). D’. Densitometry showing the ratio of pErk/actin in D.
Figure 3
Figure 3. Shh upregulates FGF 1, 2, 3 and FGFR1
A. Quantitative real time RTPCR analysis of E4 CB/CMZ explants stimulated with Shh show that Shh treatment stimulated a significant increase in expression above control tissue for FGF1 (1.85 fold). B. Shh triggered a significant increase in FGF2 expression above control tissue (1.65 fold). C. Shh caused a significant increase in FGF3 expression above control tissue (2.89 fold). D. Shh produced a significant increase in FGFR1 expression above control tissue (1.54 fold) E. Shh did not trigger a significant increase in FGFR2 expression above control tissue. F. In addition, in control E4 CB/CMZ explants, FGFR1 and FGFR2 levels were compared. FGFR1 was expressed more than 2.5 fold over FGFR2. Error bars are S.E.M. * = p<0.05, ** = p<0.01. n.s= not significant.
Figure 4
Figure 4. Hh signaling is required for basal pErk as well as FGF induced pErk
A. pErk levels were assayed in E4 untreated CB/CMZ explants (lane 1) or in explants that were exposed to the FGFR inhibitor PD173074 (lane 2), the Hh pathway inhibitor KAAD (lane 3) or the MEK inhibitor PD98059 (lane 4). Explants were also exposed to 10ug/ml FGF2 alone (lane 5) or with PD173074 (lane 6), KAAD (lane 7) or PD98059 (lane 8). Inhibiting the Hh pathway reduced the levels of both basal pErk and FGF induced pErk. B. Densitometry showing the ratio of pErk/actin in A.
Figure 5
Figure 5. Increasing levels of FGF2 or Shh increases mitosis
PH3 labeling of mitotic cells from E4 retinectomized eyes exposed to FGF2 or Heparin beads in vivo for 24 hours revealed that FGF2 significantly increased the number mitotic cells in the NPE of the CB/CMZ (left). Eyes were also injected with Rcas-Shh or Rcas-GFP at E3 and retinas removed at E4. Eyes were collected, sectioned and assayed for PH3 positive cells 24 hours after retinectomy. Ectopic Shh significantly increased the number of mitotic cells in the NPE of the CB/CMZ (right) *=p<0.05, n=6 sections from 3 eyes. Heparin beads represent the negative control for FGF treatments and Rcas-GFP the control for Shh treatments. Error bars are S.E.M.
Figure 6
Figure 6. Hh and FGF signaling are required for basal proliferation in the NPE of the CB/CMZ
Retinectomies were performed at E4 and chick eyes were exposed to 200uM KAAD, 50uM PD173074 or DMSO for 24 hours. PH3 labeling for mitotic cells showed that both KAAD (* = p<0.05) and PD173074 (*=p<0.01) reduced the number of mitotic cells in the NPE of the CB/CMZ. n=6 sections from 3 eyes. Error bars are S.E.M.
Figure 7
Figure 7. FGF and Hh signaling promote cell survival in the NPE of the CB/CMZ
A. Retinectomies were performed at E4 and chick eyes were exposed to 200uM KAAD, 50uM PD173074 or DMSO control beads for 4 hours. Exposure to KAAD (* = p<0.01) and PD173074 (* = p<0.001) significantly increased the number of TUNEL positive cells in the NPE of the CB/CMZ, whereas exposure to PD173074 did not. n=6 sections from 3 eyes. Error bars are S.E.M. B. Retinectomies were performed at E4 and chick eyes were exposed to 200uM KAAD, 50uM PD173074 or DMSO control beads for 24 hours. Exposure to KAAD and PD173074 did not increase the number of TUNEL positive cells in the NPE of the CB/CMZ, n=6 sections from 3 eyes. Error bars are S.E.M. C. Retinectomy was performed on E4 chick eyes. Eyes were then exposed to FGF2 or DMSO control beads (left); Rcas-Shh or Rcas-GFP control (middle); DMSO control beads or DMSO control beads plus a piece of retina (right). Treatment with FGF (*=p<0.001), Rcas-Shh (*=p<0.05) or DMSO control plus retina (*=p<0.001) were all able to significantly reduce the number of TUNEL positive cells compared to their respective controls.
Figure 8
Figure 8. Maintenance of retinal progenitor cell markers is perturbed by Hh inhibition
A. Retinectomies were performed on E4 chick eyes. Eyes were then exposed to DMSO for 24 hours. Many cells in the CB/CMZ are co-expressing Pax6 and Chx10 as determined by immunohistochemistry. B. Operated eyes exposed to KAAD for 24 hours appear to have a difference in Pax6/Chx10 co-expression from control. C. Operated eyes exposed to PD173074 for 24 hours shows no difference in Pax6/Chx10 co-expression from control. D. Quantitation of the area in the NPE containing Pax6/Chx10 positive cells from eyes represented in A–C. Error bars are S.E.M. * = p<0.05. E. Quantitation of the area in the NPE containing Pax6 positive cells from eyes represented in A–C. Error bars are S.E.M. * = p<0.05. F. Quantitation of the area in the NPE containing Chx10 positive cells from eyes represented in A–C. Error bars are S.E.M. ** = p<0.001. Dashed line marks the boundary between the NPE (below the line) and PE (above the line). PE = pigmented ciliary epithelium; NPE = non-pigmented ciliary epithelium; PE=pigmented epithelium; Scale bars = 50um and applies to all panels.

Similar articles

Cited by

References

    1. Agius E, Soukkarieh C, Danesin C, Kan P, Takebayashi H, Soula C, Cochard P. Converse control of oligodendrocyte and astrocyte lineage development by Sonic hedgehog in the chick spinal cord. Dev. Biol. 2004;270(2):308–321. - PubMed
    1. Amato MA, Boy S, Perron M. Hedgehog signaling in vertebrate eye development: a growing puzzle. Cell Mol. Life Sci. 2004;61(7–8):899–910. - PMC - PubMed
    1. Barnes EA, Kong M, Ollendorff V, Donoghue DJ. Patched1 interacts with cyclin B1 to regulate cell cycle progression. EMBO J. 2001;20(9):2214–2223. - PMC - PubMed
    1. Belecky-Adams T, Tomarev S, Li HS, Ploder L, McInnes RR, Sundin O, Adler R. Pax-6, Prox 1, and Chx10 homeobox gene expression correlates with phenotypic fate of retinal precursor cells. Inves.t Ophthalmol. Vis. Sci. 1997;38(7):1293–1303. - PubMed
    1. Briscoe J, Pierani A, Jessell TM, Ericson J. A homeodomain protein code specifies progenitor cell identity and neuronal fate in the ventral neural tube. Cell. 2000;101(4):435–445. - PubMed

Publication types

MeSH terms

Substances

LinkOut - more resources