

Malaria vaccine efficacy: the difficulty of detecting and diagnosing malaria
- PMID: 17386083
- PMCID: PMC1852320
- DOI: 10.1186/1475-2875-6-36
Malaria vaccine efficacy: the difficulty of detecting and diagnosing malaria
Abstract
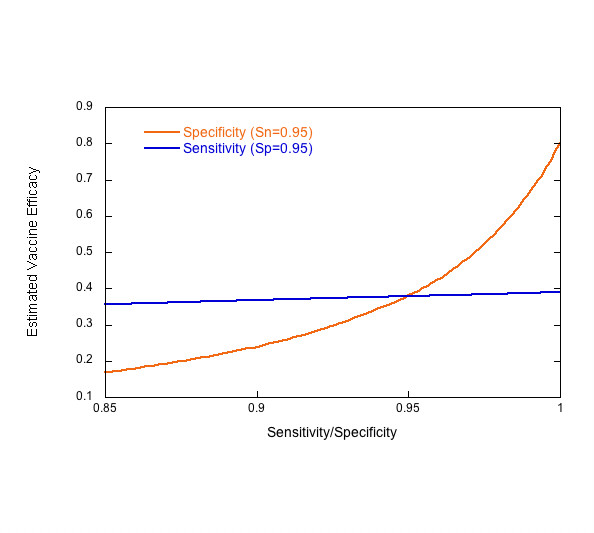
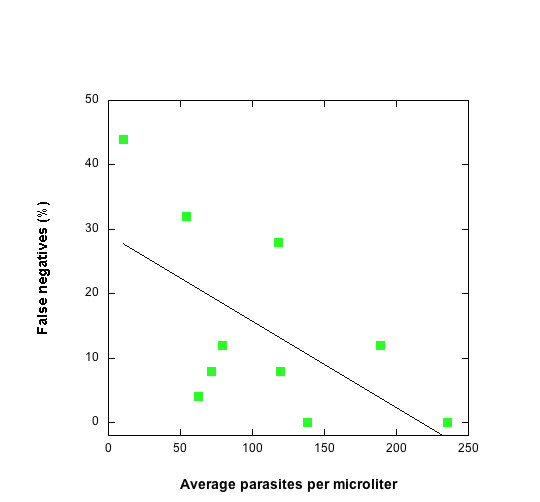
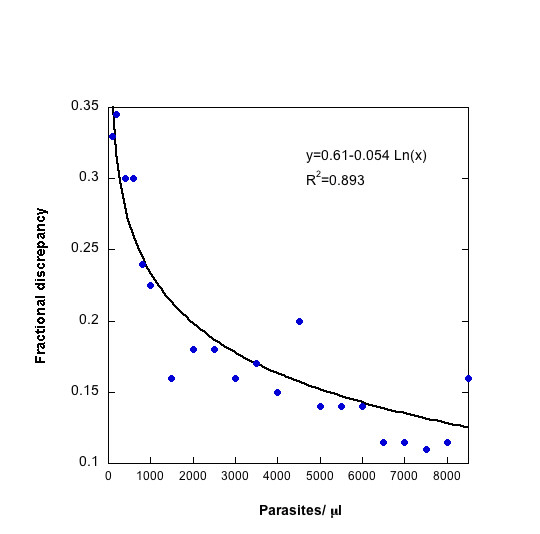
New sources of funding have revitalized efforts to control malaria. An effective vaccine would be a tremendous asset in the fight against this devastating disease and increasing financial and scientific resources are being invested to develop one. A few candidates have been tested in Phase I and II clinical trials, and several others are poised to begin trials soon. Some studies have been promising, and others disappointing. It is difficult to compare the results of these clinical trials; even independent trials of the same vaccine give highly discrepant results. One major obstacle in evaluating malaria vaccines is the difficulty of diagnosing clinical malaria. This analysis evaluates the impact of diagnostic error, particularly that introduced by microscopy, on the outcome of efficacy trials of malaria vaccines and make recommendations for improving future trials.
Figures
Similar articles
-
Folic acid supplementation and malaria susceptibility and severity among people taking antifolate antimalarial drugs in endemic areas.Cochrane Database Syst Rev. 2022 Feb 1;2(2022):CD014217. doi: 10.1002/14651858.CD014217. Cochrane Database Syst Rev. 2022. PMID: 36321557 Free PMC article.
-
Clinical case definitions and malaria vaccine efficacy.J Infect Dis. 2006 Feb 1;193(3):467-73. doi: 10.1086/499314. Epub 2005 Dec 27. J Infect Dis. 2006. PMID: 16388497
-
Laboratory diagnosis of malaria: conventional and rapid diagnostic methods.Arch Pathol Lab Med. 2013 Jun;137(6):805-11. doi: 10.5858/arpa.2011-0602-RA. Arch Pathol Lab Med. 2013. PMID: 23721276 Review.
-
Performance of malaria rapid diagnostic test in febrile under-five children at Oni Memorial Children's Hospital in Ibadan, Nigeria, 2016.Pan Afr Med J. 2018 Aug 1;30:242. doi: 10.11604/pamj.2018.30.242.13268. eCollection 2018. Pan Afr Med J. 2018. PMID: 30574261 Free PMC article.
-
Malaria vaccine trials.Chem Immunol. 2002;80:366-95. doi: 10.1159/000058836. Chem Immunol. 2002. PMID: 12058650 Review. No abstract available.
Cited by
-
Effect of supplementation with zinc and other micronutrients on malaria in Tanzanian children: a randomised trial.PLoS Med. 2011 Nov;8(11):e1001125. doi: 10.1371/journal.pmed.1001125. Epub 2011 Nov 22. PLoS Med. 2011. PMID: 22131908 Free PMC article. Clinical Trial.
-
Effect of α(+)-thalassaemia on episodes of fever due to malaria and other causes: a community-based cohort study in Tanzania.Malar J. 2011 Sep 22;10:280. doi: 10.1186/1475-2875-10-280. Malar J. 2011. PMID: 21939508 Free PMC article.
-
Estimating malaria parasite density among pregnant women at central Sudan using actual and assumed white blood cell count.Malar J. 2014 Jan 5;13:6. doi: 10.1186/1475-2875-13-6. Malar J. 2014. PMID: 24386962 Free PMC article.
-
In vitro invasion inhibition assay using antibodies against Plasmodium knowlesi Duffy binding protein alpha and apical membrane antigen protein 1 in human erythrocyte-adapted P. knowlesi A1-H.1 strain.Malar J. 2018 Jul 27;17(1):272. doi: 10.1186/s12936-018-2420-4. Malar J. 2018. PMID: 30049277 Free PMC article.
-
Detection of Plasmodium falciparum histidine-rich protein II in saliva of malaria patients.Am J Trop Med Hyg. 2008 May;78(5):733-5. Am J Trop Med Hyg. 2008. PMID: 18458305 Free PMC article.
References
-
- Blackwelder WC, Storsaeter J, Olin P, Hallander HO. Acellular Pertussis Vaccines - Efficacy and Evaluation of Clinical Case Definitions. Am J Dis Child. 1991;145:1285–1289. - PubMed
-
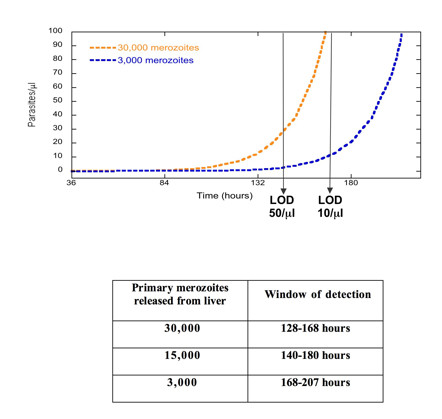
- Bejon P, Andrews L, Andersen RF, Dunachie S, Webster D, Walther M, Gilbert SC, Peto T, Hill AVS. Calculation of liver-to-blood inocula, parasite growth rates, and preerythrocytic vaccine efficacy, from serial quantitative polymerase chain reaction studies of volunteers challenged with malaria sporozoites. J Infect Dis. 2005;191:619–626. doi: 10.1086/427243. - DOI - PubMed
Publication types
MeSH terms
Substances
Grants and funding
LinkOut - more resources
Full Text Sources
Medical
