Comparative Study
. 2007 Mar 26:8:101.
doi: 10.1186/1471-2105-8-101.

LIMPIC: a computational method for the separation of protein MALDI-TOF-MS signals from noise

Affiliations
Comparative Study

LIMPIC: a computational method for the separation of protein MALDI-TOF-MS signals from noise

Dante Mantini et al. BMC Bioinformatics. .

Abstract

Background: Mass spectrometry protein profiling is a promising tool for biomarker discovery in clinical proteomics. However, the development of a reliable approach for the separation of protein signals from noise is required. In this paper, LIMPIC, a computational method for the detection of protein peaks from linear-mode MALDI-TOF data is proposed. LIMPIC is based on novel techniques for background noise reduction and baseline removal. Peak detection is performed considering the presence of a non-homogeneous noise level in the mass spectrum. A comparison of the peaks collected from multiple spectra is used to classify them on the basis of a detection rate parameter, and hence to separate the protein signals from other disturbances.

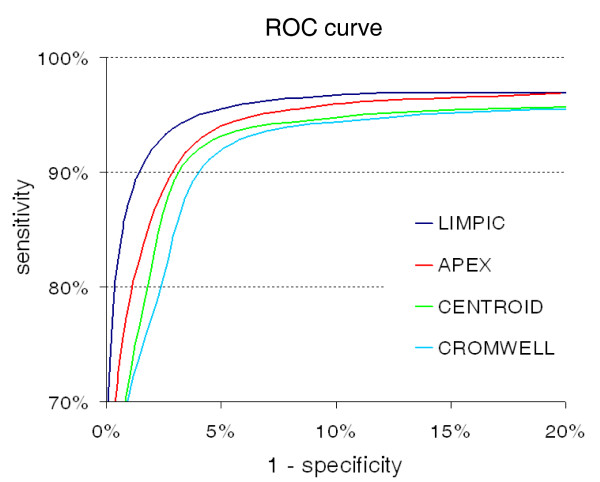
Results: LIMPIC preprocessing proves to be superior than other classical preprocessing techniques, allowing for a reliable decomposition of the background noise and the baseline drift from the MALDI-TOF mass spectra. It provides lower coefficient of variation associated with the peak intensity, improving the reliability of the information that can be extracted from single spectra. Our results show that LIMPIC peak-picking is effective even in low protein concentration regimes. The analytical comparison with commercial and freeware peak-picking algorithms demonstrates its superior performances in terms of sensitivity and specificity, both on in-vitro purified protein samples and human plasma samples.

Conclusion: The quantitative information on the peak intensity extracted with LIMPIC could be used for the recognition of significant protein profiles by means of advanced statistic tools: LIMPIC might be valuable in the perspective of biomarker discovery.


Figures

Figure 1
Figure 1
LIMPIC architecture. Schematic representation of the LIMPIC software. Through its processing and analysis steps, LIMPIC retrieves information from a set of calibrated MALDI-TOF mass spectra, and provides a list of "true" molecular signal peaks.
Figure 2
Figure 2
MALDI-TOF-MS spectrum from a human plasma sample. Example of raw MALDI-TOF mass spectrum acquired from human plasma, showing the presence of background noise and baseline drift.
Figure 3
Figure 3
Analysis of Kaiser filter denoising. The Kaiser filter performances can be appreciated from the difference between mass spectra before and after smoothing. The outcomes for the mass spectrum shown in Figure 2, referring to moving window length equal to 10, 20, 30 and 40 data points, are respectively presented in (a), (b), (c) and (d).
Figure 4
Figure 4
Smoothing performance comparison. The performances of several smoothing algorithms can be appreciated from the difference between mass spectra before and after smoothing. The outcomes obtained from Savitzky-Golay, Wavelet and Kaiser filters for the mass spectrum shown in Figure 2 are respectively illustrated in (a), (b) and (c).
Figure 5
Figure 5
Baseline removal performance comparison. The baseline drift estimated with the minimum-value interpolation method (APEX, CENTROID and CROMWELL processing) is compared with that of the peak-elimination method (LIMPIC processing).
Figure 6
Figure 6
Denoising performances. The MALDI-TOF mass spectrum presented in Figure 2 is shown in the mass ranges 5–8 kDa (a) and 14.75–17.75 kDa (b). The comparison between the noise subtracted by LIMPIC (c-d), APEX and CENTROID (e-f), and CROMWELL (g-h) in the same mass ranges is presented in the panes below.
Figure 7
Figure 7
Peak-picking for a single mass spectrum. Example of the peak-detection results for the four algorithms. For each of them, a plot of the mass spectrum shown in Figure 2 in the mass range 8.73–9.02 kDa is shown, along with the detected peaks, marked by red crosses.
Figure 8
Figure 8
LIMPIC classification of protein and noise peaks. The same peaks detected by LIMPIC, shown in figure 7, classified after multiple-spectra comparison. The peaks with detection rate across spectra larger than or equal to 0.5, being considered protein peaks, are marked with green crosses, whereas the remaining peaks are assumed to be ascribed to noise and are marked with red crosses.
Figure 9
Figure 9
Multiple-spectra analysis of the peaks detected with LIMPIC. The results of peak detection rate (PDR) associated with all the LIMPIC peak classes are presented for plasma mass spectra, as well as those of signal-to-noise ratio (SNR) of the "true" protein peaks, characterized by a PDR larger than or equal to 0.5. (a) For each peak class, the PDR is represented in linear scale as a vertical line, which is positioned in correspondence of the related m/z value; (b) Histogram of the PDR values shown in (a); (c) For each selected peak class, the SNR is represented in logarithmic scale as a vertical line, which is positioned in correspondence of the related m/z value; (d) Histogram of the average SNR values shown in (c).
Figure 10
Figure 10
ROC curves calculated for peak-detection methods with human plasma samples. ROC curves showing the sensitivity and specificity of LIMPIC, APEX, CENTROID and CROMWELL. These indexes have been computed for the mass spectra obtained from human plasma.

References

    1. Rifai N, Gillette MA, Carr SA. Protein biomarker discovery and validation: the long and uncertain path to clinical utility. Nat Biotechnol. 2006;24:971–983. doi: 10.1038/nbt1235. - DOI - PubMed
    1. Diamandis EP. Mass spectrometry as a diagnostic and a cancer biomarker discovery tool: opportunities and potential limitations. Mol Cell Proteomics. 2004;3:367–378. doi: 10.1074/mcp.R400007-MCP200. - DOI - PubMed
    1. Reyzer ML, Caprioli RM. MALDI mass spectrometry for direct tissue analysis: a new tool for biomarker discovery. J Proteome Res. 2005;4:1138–1142. doi: 10.1021/pr050095+. - DOI - PubMed
    1. Bonk T, Humeny A. MALDI-TOF-MS analysis of protein and DNA. Neuroscientist. 2001;7:6–12. - PubMed
    1. Maddalo G, Petrucci F, Iezzi M, Pannellini T, Del Boccio P, Ciavardelli D, Biroccio A, Forli F, Di Ilio C, Ballone E, Urbani A, Federici G. Analytical assessment of MALDI-TOF Imaging Mass Spectrometry on thin histological samples. An insight in proteome investigation. Clin Chim Acta. 2005;357:210–218. doi: 10.1016/j.cccn.2005.03.029. - DOI - PubMed

Publication types

MeSH terms

LinkOut - more resources