. 2007;8(3):R43.
doi: 10.1186/gb-2007-8-3-r43.

Genome mapping and expression analyses of human intronic noncoding RNAs reveal tissue-specific patterns and enrichment in genes related to regulation of transcription

Affiliations

Genome mapping and expression analyses of human intronic noncoding RNAs reveal tissue-specific patterns and enrichment in genes related to regulation of transcription

Helder I Nakaya et al. Genome Biol. 2007.

Abstract

Background: RNAs transcribed from intronic regions of genes are involved in a number of processes related to post-transcriptional control of gene expression. However, the complement of human genes in which introns are transcribed, and the number of intronic transcriptional units and their tissue expression patterns are not known.

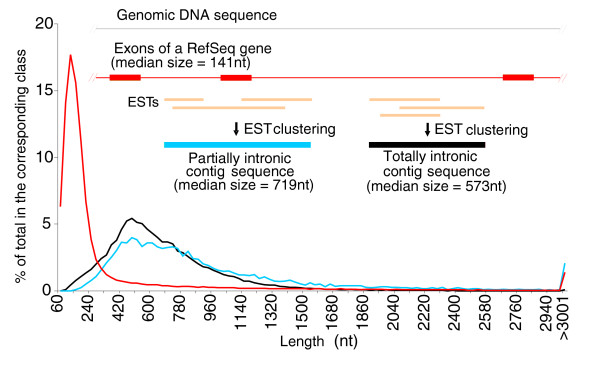
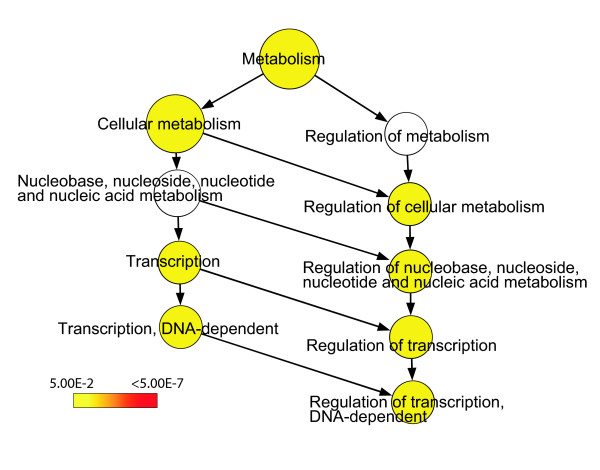
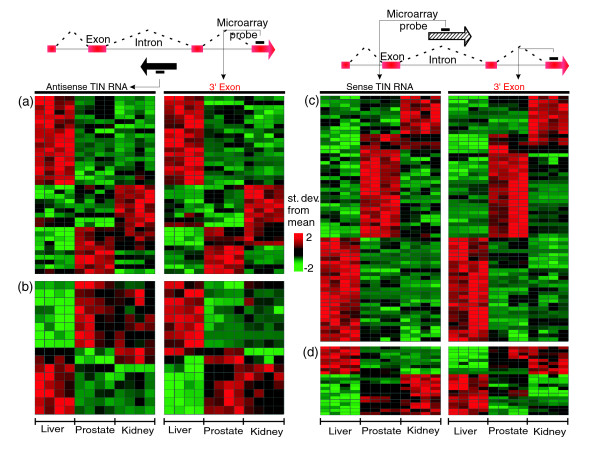
Results: A survey of mRNA and EST public databases revealed more than 55,000 totally intronic noncoding (TIN) RNAs transcribed from the introns of 74% of all unique RefSeq genes. Guided by this information, we designed an oligoarray platform containing sense and antisense probes for each of 7,135 randomly selected TIN transcripts plus the corresponding protein-coding genes. We identified exonic and intronic tissue-specific expression signatures for human liver, prostate and kidney. The most highly expressed antisense TIN RNAs were transcribed from introns of protein-coding genes significantly enriched (p = 0.002 to 0.022) in the 'Regulation of transcription' Gene Ontology category. RNA polymerase II inhibition resulted in increased expression of a fraction of intronic RNAs in cell cultures, suggesting that other RNA polymerases may be involved in their biosynthesis. Members of a subset of intronic and protein-coding signatures transcribed from the same genomic loci have correlated expression patterns, suggesting that intronic RNAs regulate the abundance or the pattern of exon usage in protein-coding messages.

Conclusion: We have identified diverse intronic RNA expression patterns, pointing to distinct regulatory roles. This gene-oriented approach, using a combined intron-exon oligoarray, should permit further comparative analysis of intronic transcription under various physiological and pathological conditions, thus advancing current knowledge about the biological functions of these noncoding RNAs.


Figures

Figure 1
Figure 1
Length distribution of exons from RefSeq genes and of partially (PIN) and totally (TIN) intronic noncoding transcripts. The curves show the length distribution of three different classes of transcripts reconstructed from genomic mapping and assembly of RefSeq and ESTs from GenBank. Exons of protein-coding RefSeq (red line), TIN (black line) and PIN (blue line) contig sequences. TIN and PIN contigs resulted from assembly of all GenBank unspliced ESTs (in gold) that cluster to a given intronic region in a genomic locus, as shown in the scheme above the curves.
Figure 2
Figure 2
Frequency of exon skipping and abundance of wholly intronic noncoding transcription in RefSeq genes. (a) Distribution of exon skipping events along spliced RefSeq genes with 7, 8, 9 or 10 exons. Filled squares indicate the average frequency of skipping per exon for genes with evidence of TIN RNAs mapping to their introns. Open squares indicate the average frequency of skipping per exon for genes with no evidence in GenBank that TIN RNAs map to their introns. A significantly higher (p < 0.002) frequency of exon skipping was observed for RefSeq genes with TIN RNA transcription. (b) Distribution of TIN transcripts among the introns of RefSeq sequences with 7, 8, 9 or 10 introns selected from GenBank as being outside the 95% confidence level of significance (not correlated) in a Pearson correlation analysis between the abundance of TIN contigs per intron and the intron size (in nt). Bars indicate the average intron size (nt) for this selected set of genes. Triangles indicate the number of TIN contigs per intron for RefSeq genes for the same set.
Figure 3
Figure 3
Design and overall performance of the 44 k gene-oriented intron-exon expression oligoarray. (a) Schematic view of the 44 k combined intron-exon expression oligoarray 60-mer probe design. Probe 1 is for the antisense PIN transcripts (blue arrow). Probes 3 and 4 are a pair of reverse complementary sequences designed to detect antisense or sense TIN transcripts (black and hashed black arrows, respectively) in a given locus. Sense exonic probes 2 and 5 are for the protein-coding transcripts (red block and red arrow). Note that the latter were not systematically designed for an exon near the TIN message; in most instances a distant, 3' exon of the gene has been probed instead. (b) Average signal intensity distribution for antisense TIN (solid black line), sense TIN (dashed line), antisense PIN (blue line), or sense protein-coding exonic (red line) probes. Average intensities from six different hybridization experiments with three different human tissues, namely liver, prostate and kidney, are shown. Only probes with intensities above the average negative controls plus 2 SD were considered. The average intensity distribution for probes below this low-limit detection cutoff is shown in the curve marked as 'Not expressed RNAs' (gray line).
Figure 4
Figure 4
Number of protein-coding, TIN and PIN transcripts expressed in three human tissues. Different types of transcripts are shown in each panel, and are color-coded as in Figure 3: protein-coding exonic (red bars), antisense TIN (black bars), antisense PIN (blue bars) or sense TIN transcripts (hashed black bars). The total number of probes present in the microarray for each type of transcript is shown with bars marked as 'M'. The number of transcripts expressed in at least one of the three tissues tested is shown with bars marked as 'One'. Transcripts exclusively expressed in each of the three tissues are shown with bars marked as 'L' for liver; 'P' for prostate; or 'K' for kidney. The percentage of expressed transcripts relative to the total number of transcripts probed in the array is indicated at the top of each bar.
Figure 5
Figure 5
Genomic distribution of intronic RNAs. Relative chromosome sizes (blue bars) and the fractional number of GenBank Refseq genes (red bars) mapped per chromosome are shown. The distribution along the chromosomes of wholly intronic sequence contigs resulting from mapping and assembly of all ESTs in GenBank relative to the RefSeq reference dataset is shown (black bars). The distribution along the chromosomes of intronic RNAs expressed in human liver, as detected by oligoarray hybridizations, is shown as gray ears. The numbers on the y-axis refer to the fractional distribution in each chromosome.
Figure 6
Figure 6
Sense-antisense TIN transcript pairs simultaneously detected at different ranges of signal intensities for each of three different tissues. The percentages of TIN transcript pairs simultaneously transcribed from the same genomic locus in both the sense and antisense orientations (full symbols), and detected at different ranges of signal intensities, are shown for each of three different tissues: liver (diamonds), prostate (triangles) and kidney (squares). The percentages of TIN messages transcribed in each tissue from only one of the two DNA strands (sense or antisense) are shown as open symbols.
Figure 7
Figure 7
Most highly expressed TIN transcripts map to genes related to regulation of transcription. TIN RNA expression data from three different human tissues (prostate, liver and kidney) were used to select the protein-coding genes to which the top 40% most highly expressed TIN transcripts map. The BiNGO program was used to identify significantly (p ≤ 0.05) enriched GO terms within the set of selected protein-coding genes. (a) GO-enriched categories for prostate are shown in color, which is related to the p value as indicated by the color-code bar. The exact p values for all significantly enriched GO categories are shown in Additional data file 4. GO category 'Regulation of transcription, DNA-dependent' (GO:006355) is the most significantly enriched (p = 0.002). Similar results were obtained for liver and kidney (see Additional data file 4). (b) Venn diagram for the 123 unique protein-coding genes belonging to GO:006355 category 'Regulation of transcription, DNA-dependent'. The number of genes in each tissue for which intronic transcription was detected is shown in parenthesis; the numbers of coincident and dissimilar genes among kidney, prostate and liver are shown in the circles.
Figure 8
Figure 8
Effect of RNAP II inhibitor α-amanitin on the abundance of protein-coding, antisense TIN, sense TIN and antisense PIN RNAs. Lines on each panel represent various transcripts for which the expression levels differed significantly between α-amanitin-treated prostate cells and untreated control cells. Each sample replica is shown in one column. Transcripts were selected by a SAM two-class test (FDR <0.2% to 2%) combined with a signal-to-noise test (p ≤ 0.05). For each line, expression intensities were normalized between the two conditions and colored as a function of the number of standard deviations from the mean value; (a) 3,604 significantly affected protein-coding transcripts; (b) 265 significantly affected antisense TIN transcripts; (c) 326 significantly affected sense TIN transcripts; (d) 339 significantly affected antisense PIN transcripts.
Figure 9
Figure 9
Genes with increased intronic transcription in the presence of the RNAP II inhibitor α-amanitin are enriched in the 'Regulation of transcription' GO category. Gene ontology analysis was performed on protein-coding genes that were shown in the experiment illustrated in Figure 8 to have up-regulated expression of antisense PIN transcripts and sense and antisense TIN transcripts upon exposure to α-amanitin. Significantly (p ≤ 0.05) enriched GO terms are shown in color, which is related to the p value as indicated by the color-code bar. The exact p values for all significantly enriched GO categories are shown in Additional data file 7.
Figure 10
Figure 10
Expression signature of intronic and protein-coding transcripts in human liver, prostate and kidney. Transcripts with significantly different levels among prostate, kidney and liver samples were selected by a SAM multi-class test (FDR <0.002) combined with an ANOVA test (p ≤ 0.001) and hierarchically clustered as described in the Materials and methods. In each panel the selected transcripts are shown in the lines and sample replicas in the columns. For each line, expression intensities among the three tissues were normalized within each type of probe and colored as a function of the number of standard deviations from the mean value. (a) Tissue expression signature of 419 antisense TIN transcripts. (b) Tissue expression signature of 567 sense TIN transcripts. (c) Tissue expression signature of 431 antisense PIN transcripts. (d) Tissue expression signature of 2,809 protein-coding transcripts.
Figure 11
Figure 11
Expression signatures of antisense PIN RNAs and corresponding PIN RNA-overlapped exon pairs relative to their 3' protein-coding exons. A subset of 64 pairs of antisense PIN RNAs and corresponding PIN RNA-overlapped exons were identified among the tissue signatures shown in Figure 10 as having correlated patterns of expression: (a) 49 pairs were identified in which the 3' exon of the protein-coding transcript (right panel) follows a similar expression pattern to that of the PIN RNA/PIN RNA-overlapped exon pair (left and central panels); (b) 9 pairs were identified in which the 3' exon of the protein-coding transcript (right panel) does not follow the pattern of tissue expression of the PIN RNA and the corresponding PIN RNA-overlapped exon (left and central panels); (c) 6 pairs in which the PIN RNA (left panel) has an expression pattern inverted in relation to that of the PIN RNA-overlapped exon (central panel). Each line represents a genomic locus covered by three different types of probes (antisense PIN RNA, PIN RNA-overlapped protein-coding exon and 3' protein-coding exon). For each line, expression intensities among the three tissues were normalized within each type of probe and colored as a function of the number of standard deviations from the mean value.
Figure 12
Figure 12
Expression signatures of wholly intronic RNAs relative to their 3' protein-coding exons. Cross-referencing of the tissue signatures shown in Figure 10 identified subsets of TIN RNAs that have correlated patterns of expression relative to the 3' protein-coding exon signature from the corresponding genomic loci: (a) 38 pairs were identified in which the 3' exon of the protein-coding transcript (right panel) follows a similar expression pattern to that of the antisense TIN RNA (left panel); (b) 16 pairs were identified in which the 3' exon of the protein-coding transcript (right panel) follows a pattern of tissue expression inverted in relation to that of the antisense TIN RNA (left panel); (c) 64 pairs were identified in which the 3' exon of the protein-coding transcript (right panel) follows a similar expression pattern as that of the sense TIN RNA (left panel); (d) 22 pairs were identified where the 3' exon of the protein-coding transcript (right panel) follows a pattern of tissue expression inverted in relation to that of the sense TIN RNA (left panel). For each line in each panel, expression intensities among the three tissues were normalized within each type of probe and colored as a function of the number of standard deviations from the mean value.

Similar articles

Cited by

References

    1. Reis EM, Ojopi EP, Alberto FL, Rahal P, Tsukumo F, Mancini UM, Guimaraes GS, Thompson GM, Camacho C, Miracca E. et al.Large-scale transcriptome analyses reveal new genetic marker candidates of head, neck, and thyroid cancer. Cancer Res. 2005;65:1693–1699. doi: 10.1158/0008-5472.CAN-04-3506. - DOI - PubMed
    1. Ferguson DA, Chiang JT, Richardson JA, Graff J. eXPRESSION: an in silico tool to predict patterns of gene expression. Gene Expr Patterns. 2005;5:619–628. doi: 10.1016/j.modgep.2005.03.003. - DOI - PubMed
    1. Gupta S, Zink D, Korn B, Vingron M, Haas SA. Genome wide identification and classification of alternative splicing based on EST data. Bioinformatics. 2004;20:2579–2585. doi: 10.1093/bioinformatics/bth288. - DOI - PubMed
    1. Thanaraj TA, Clark F, Muilu J. Conservation of humanalternative splice events in mouse. Nucleic Acids Res. 2003;31:2544–2552. doi: 10.1093/nar/gkg355. - DOI - PMC - PubMed
    1. Kan Z, Rouchka EC, Gish WR, States DJ. Gene structure prediction and alternative splicing analysis using genomically aligned ESTs. Genome Res. 2001;11:889–900. doi: 10.1101/gr.155001. - DOI - PMC - PubMed

Publication types

Substances

Associated data