

Engineering proteinase K using machine learning and synthetic genes
- PMID: 17386103
- PMCID: PMC1847811
- DOI: 10.1186/1472-6750-7-16
Engineering proteinase K using machine learning and synthetic genes
Abstract
Background: Altering a protein's function by changing its sequence allows natural proteins to be converted into useful molecular tools. Current protein engineering methods are limited by a lack of high throughput physical or computational tests that can accurately predict protein activity under conditions relevant to its final application. Here we describe a new synthetic biology approach to protein engineering that avoids these limitations by combining high throughput gene synthesis with machine learning-based design algorithms.
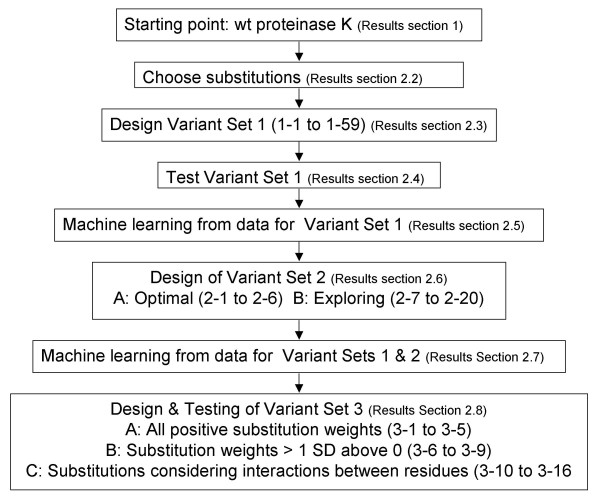
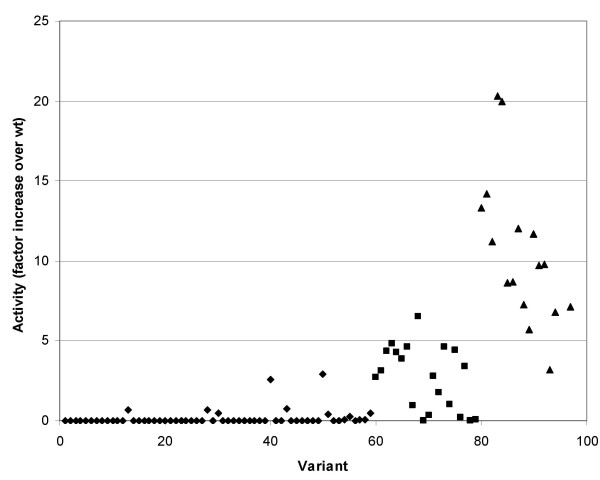
Results: We selected 24 amino acid substitutions to make in proteinase K from alignments of homologous sequences. We then designed and synthesized 59 specific proteinase K variants containing different combinations of the selected substitutions. The 59 variants were tested for their ability to hydrolyze a tetrapeptide substrate after the enzyme was first heated to 68 degrees C for 5 minutes. Sequence and activity data was analyzed using machine learning algorithms. This analysis was used to design a new set of variants predicted to have increased activity over the training set, that were then synthesized and tested. By performing two cycles of machine learning analysis and variant design we obtained 20-fold improved proteinase K variants while only testing a total of 95 variant enzymes.
Conclusion: The number of protein variants that must be tested to obtain significant functional improvements determines the type of tests that can be performed. Protein engineers wishing to modify the property of a protein to shrink tumours or catalyze chemical reactions under industrial conditions have until now been forced to accept high throughput surrogate screens to measure protein properties that they hope will correlate with the functionalities that they intend to modify. By reducing the number of variants that must be tested to fewer than 100, machine learning algorithms make it possible to use more complex and expensive tests so that only protein properties that are directly relevant to the desired application need to be measured. Protein design algorithms that only require the testing of a small number of variants represent a significant step towards a generic, resource-optimized protein engineering process.
Figures
Similar articles
-
Accurate prediction of enzyme mutant activity based on a multibody statistical potential.Bioinformatics. 2007 Dec 1;23(23):3155-61. doi: 10.1093/bioinformatics/btm509. Epub 2007 Oct 31. Bioinformatics. 2007. PMID: 17977887
-
Accurate prediction of stability changes in protein mutants by combining machine learning with structure based computational mutagenesis.Bioinformatics. 2008 Sep 15;24(18):2002-9. doi: 10.1093/bioinformatics/btn353. Epub 2008 Jul 16. Bioinformatics. 2008. PMID: 18632749
-
Optimizing scaleup yield for protein production: Computationally Optimized DNA Assembly (CODA) and Translation Engineering.Biotechnol Annu Rev. 2007;13:27-42. doi: 10.1016/S1387-2656(07)13002-7. Biotechnol Annu Rev. 2007. PMID: 17875472 Review.
-
Characterization of a recombinantly expressed proteinase K-like enzyme from a psychrotrophic Serratia sp.FEBS J. 2006 Jan;273(1):47-60. doi: 10.1111/j.1742-4658.2005.05044.x. FEBS J. 2006. PMID: 16367747
-
Enantioselective biocatalysis optimized by directed evolution.Curr Opin Biotechnol. 2004 Aug;15(4):305-13. doi: 10.1016/j.copbio.2004.06.007. Curr Opin Biotechnol. 2004. PMID: 15358000 Review.
Cited by
-
Engineering genes for predictable protein expression.Protein Expr Purif. 2012 May;83(1):37-46. doi: 10.1016/j.pep.2012.02.013. Epub 2012 Mar 8. Protein Expr Purif. 2012. PMID: 22425659 Free PMC article. Review.
-
Selection of target-binding proteins from the information of weakly enriched phage display libraries by deep sequencing and machine learning.MAbs. 2023 Jan-Dec;15(1):2168470. doi: 10.1080/19420862.2023.2168470. MAbs. 2023. PMID: 36683172 Free PMC article.
-
DisCoTune: versatile auxiliary plasmids for the production of disulphide-containing proteins and peptides in the E. coli T7 system.Microb Biotechnol. 2021 Nov;14(6):2566-2580. doi: 10.1111/1751-7915.13895. Epub 2021 Aug 18. Microb Biotechnol. 2021. PMID: 34405535 Free PMC article.
-
Protein Science Meets Artificial Intelligence: A Systematic Review and a Biochemical Meta-Analysis of an Inter-Field.Front Bioeng Biotechnol. 2022 Jul 7;10:788300. doi: 10.3389/fbioe.2022.788300. eCollection 2022. Front Bioeng Biotechnol. 2022. PMID: 35875501 Free PMC article.
-
Inverse folding of protein complexes with a structure-informed language model enables unsupervised antibody evolution.bioRxiv [Preprint]. 2023 Dec 21:2023.12.19.572475. doi: 10.1101/2023.12.19.572475. bioRxiv. 2023. Update in: Science. 2024 Jul 5;385(6704):46-53. doi: 10.1126/science.adk8946. PMID: 38187780 Free PMC article. Updated. Preprint.
References
Publication types
MeSH terms
Substances
LinkOut - more resources
Full Text Sources
Other Literature Sources
