

Functionality or transcriptional noise? Evidence for selection within long noncoding RNAs
- PMID: 17387145
- PMCID: PMC1855172
- DOI: 10.1101/gr.6036807
Functionality or transcriptional noise? Evidence for selection within long noncoding RNAs
Abstract
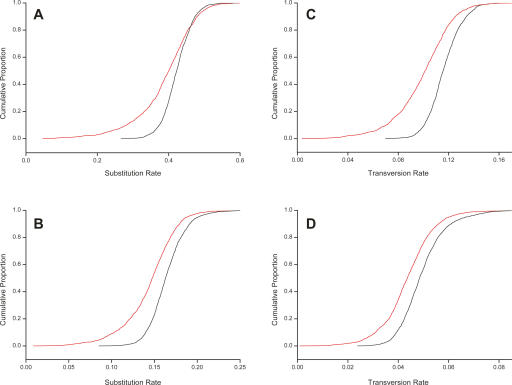
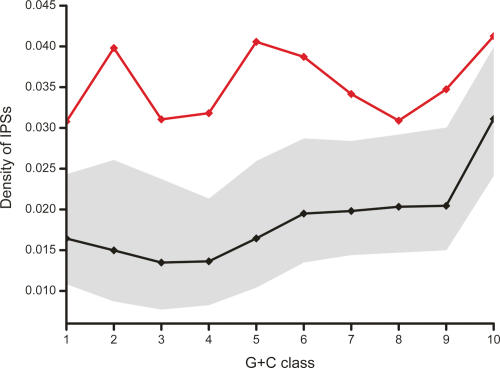
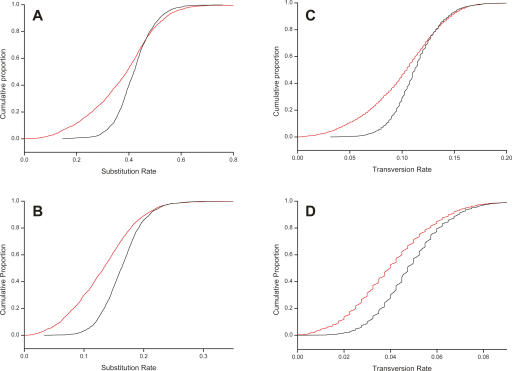
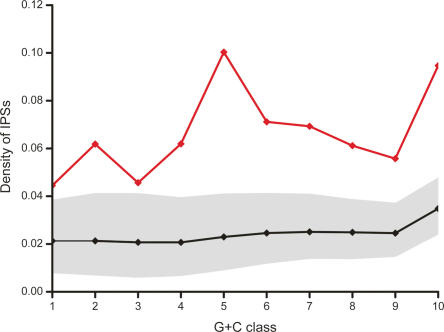
Long transcripts that do not encode protein have only rarely been the subject of experimental scrutiny. Presumably, this is owing to the current lack of evidence of their functionality, thereby leaving an impression that, instead, they represent "transcriptional noise." Here, we describe an analysis of 3122 long and full-length, noncoding RNAs ("macroRNAs") from the mouse, and compare their sequences and their promoters with orthologous sequence from human and from rat. We considered three independent signatures of purifying selection related to substitutions, sequence insertions and deletions, and splicing. We find that the evolution of the set of noncoding RNAs is not consistent with neutralist explanations. Rather, our results indicate that purifying selection has acted on the macroRNAs' promoters, primary sequence, and consensus splice site motifs. Promoters have experienced the greatest elimination of nucleotide substitutions, insertions, and deletions. The proportion of conserved sequence (4.1%-5.5%) in these macroRNAs is comparable to the density of exons within protein-coding transcripts (5.2%). These macroRNAs, taken together, thus possess the imprint of purifying selection, thereby indicating their functionality. Our findings should now provide an incentive for the experimental investigation of these macroRNAs' functions.
Figures
References
-
- Altschul S.F., Gish W., Miller W., Myers E.W., Lipman D.J., Gish W., Miller W., Myers E.W., Lipman D.J., Miller W., Myers E.W., Lipman D.J., Myers E.W., Lipman D.J., Lipman D.J. Basic local alignment search tool. J. Mol. Biol. 1990;215:403–410. - PubMed
-
- Badger J.H., Olsen G.J., Olsen G.J. CRITICA: Coding region identification tool invoking comparative analysis. Mol. Biol. Evol. 1999;16:512–524. - PubMed
-
- Bertone P., Stolc V., Royce T.E., Rozowsky J.S., Urban A.E., Zhu X., Rinn J.L., Tongprasit W., Samanta M., Weissman S., Stolc V., Royce T.E., Rozowsky J.S., Urban A.E., Zhu X., Rinn J.L., Tongprasit W., Samanta M., Weissman S., Royce T.E., Rozowsky J.S., Urban A.E., Zhu X., Rinn J.L., Tongprasit W., Samanta M., Weissman S., Rozowsky J.S., Urban A.E., Zhu X., Rinn J.L., Tongprasit W., Samanta M., Weissman S., Urban A.E., Zhu X., Rinn J.L., Tongprasit W., Samanta M., Weissman S., Zhu X., Rinn J.L., Tongprasit W., Samanta M., Weissman S., Rinn J.L., Tongprasit W., Samanta M., Weissman S., Tongprasit W., Samanta M., Weissman S., Samanta M., Weissman S., Weissman S., et al. Global identification of human transcribed sequences with genome tiling arrays. Science. 2004;306:2242–2246. - PubMed
-
- Birney E., Andrews D., Caccamo M., Chen Y., Clarke L., Coates G., Cox T., Cunningham F., Curwen V., Cutts T., Andrews D., Caccamo M., Chen Y., Clarke L., Coates G., Cox T., Cunningham F., Curwen V., Cutts T., Caccamo M., Chen Y., Clarke L., Coates G., Cox T., Cunningham F., Curwen V., Cutts T., Chen Y., Clarke L., Coates G., Cox T., Cunningham F., Curwen V., Cutts T., Clarke L., Coates G., Cox T., Cunningham F., Curwen V., Cutts T., Coates G., Cox T., Cunningham F., Curwen V., Cutts T., Cox T., Cunningham F., Curwen V., Cutts T., Cunningham F., Curwen V., Cutts T., Curwen V., Cutts T., Cutts T., et al. Ensembl 2006. Nucleic Acids Res. 2006;34:D556–D561. - PMC - PubMed
Publication types
MeSH terms
Substances
Grants and funding
LinkOut - more resources
Full Text Sources
Other Literature Sources