

Dose dependence of mass and microcalcification detection in digital mammography: free response human observer studies
- PMID: 17388156
- PMCID: PMC1892618
- DOI: 10.1118/1.2405324
Dose dependence of mass and microcalcification detection in digital mammography: free response human observer studies
Abstract
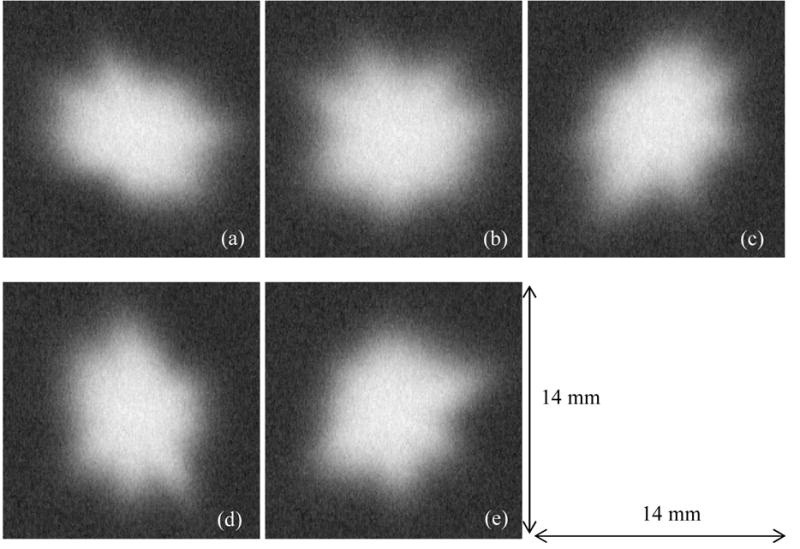
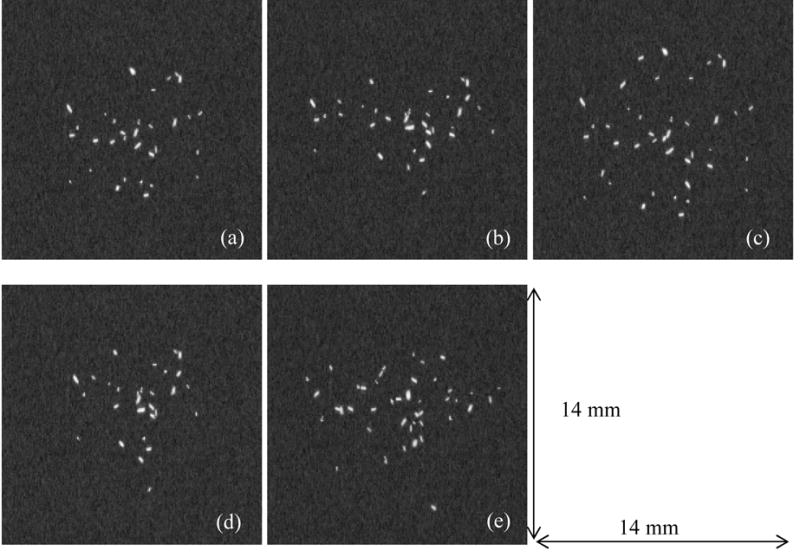
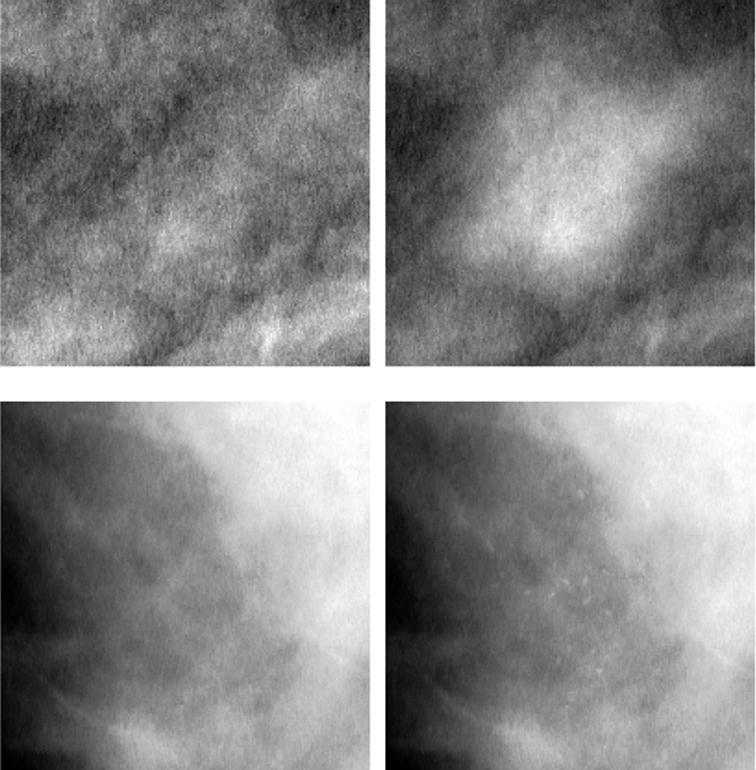
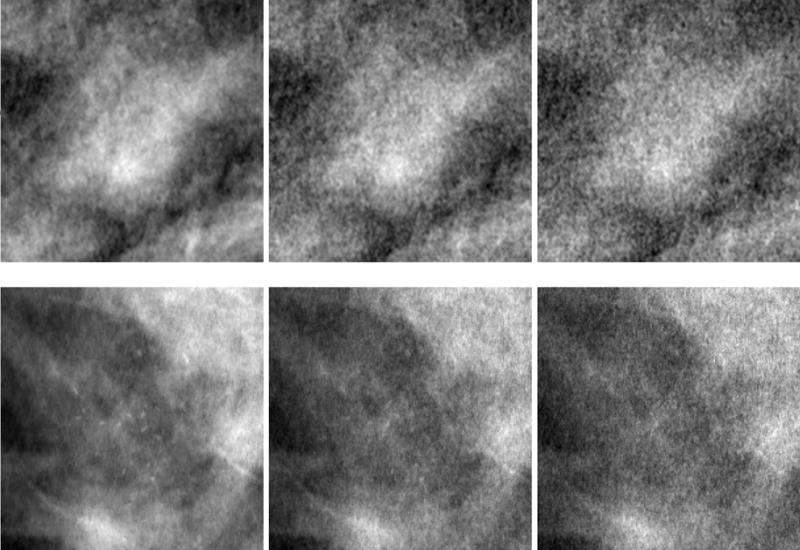
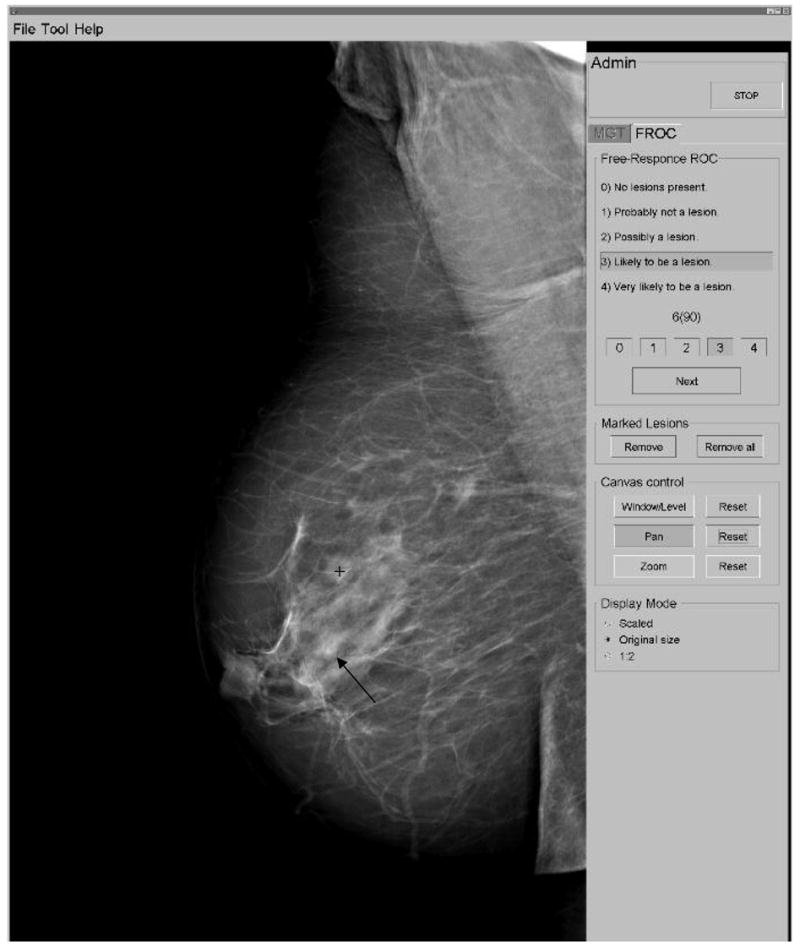
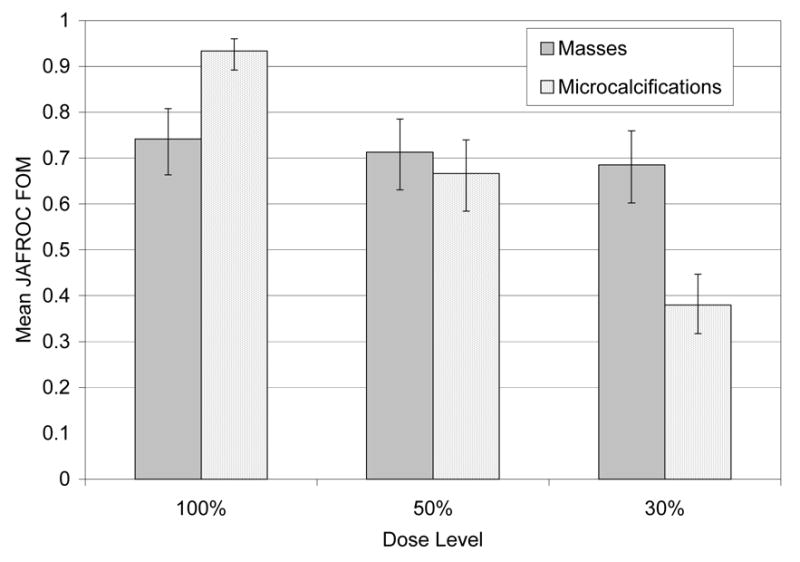
The purpose of this study was to evaluate the effect of dose reduction in digital mammography on the detection of two lesion types-malignant masses and clusters of microcalcifications. Two free-response observer studies were performed-one for each lesion type. Ninety screening images were retrospectively selected; each image was originally acquired under automatic exposure conditions, corresponding to an average glandular dose of 1.3 mGy for a standard breast (50 mm compressed breast thickness with 50% glandularity). For each study, one to three simulated lesions were added to each of 40 images (abnormals) while 50 were kept without lesions (normals). Two levels of simulated system noise were added to the images yielding two new image sets, corresponding to simulated dose levels of 50% and 30% of the original images (100%). The manufacturer's standard display processing was subsequently applied to all images. Four radiologists experienced in mammography evaluated the images by searching for lesions and marking and assigning confidence levels to suspicious regions. The search data were analyzed using jackknife free-response (JA-FROC) methodology. For the detection of masses, the mean figure-of-merit (FOM) averaged over all readers was 0.74, 0.71, and 0.68 corresponding to dose levels of 100%, 50%, and 30%, respectively. These values were not statistically different from each other (F= 1.67, p=0.19) but showed a decreasing trend. In contrast, in the microcalcification study the mean FOM was 0.93, 0.67, and 0.38 for the same dose levels and these values were all significantly different from each other (F = 109.84, p < 0.0001). The results indicate that lowering the present dose level by a factor of two compromised the detection of microcalcifications but had a weaker effect on mass detection.
Figures
References
-
- Pisano ED, Gatsonis C, Hendrick E, Yaffe M, Baum JK, Acharyya S, Conant EF, Fajardo LL, Bassett L, D'Orsi C, Jong R, Rebner M. Diagnostic performance of digital versus film mammography for breast-cancer screening. N Engl J Med. 2005;353:1773–1783. - PubMed
-
- Skaane P, Balleyguier C, Diekmann F, Diekmann S, Piguet JC, Young K, Niklason LT. Breast lesion detection and classification: comparison of screen-film mammography and full-field digital mammography with soft-copy reading--observer performance study. Radiology. 2005;237:37–44. - PubMed
-
- Bird RE, Wallace TW, Yankaskas BC. Analysis of cancers missed at screening mammography. Radiology. 1992;184:613–617. - PubMed
-
- Law J, Faulkner K. Concerning the relationship between benefit and radiation risk, and cancers detected and induced, in a breast screening programme. Br J Radiol. 2002;75:678–684. - PubMed
-
- ICRP (International Commission on Radiological Protection) ICRP 93. 2004. Managing patient dose in digital radiology. - PubMed
Publication types
MeSH terms
Grants and funding
LinkOut - more resources
Full Text Sources
Medical
