

Modeling biochemical transformation processes and information processing with Narrator
- PMID: 17389034
- PMCID: PMC1847530
- DOI: 10.1186/1471-2105-8-103
Modeling biochemical transformation processes and information processing with Narrator
Abstract
Background: Software tools that model and simulate the dynamics of biological processes and systems are becoming increasingly important. Some of these tools offer sophisticated graphical user interfaces (GUIs), which greatly enhance their acceptance by users. Such GUIs are based on symbolic or graphical notations used to describe, interact and communicate the developed models. Typically, these graphical notations are geared towards conventional biochemical pathway diagrams. They permit the user to represent the transport and transformation of chemical species and to define inhibitory and stimulatory dependencies. A critical weakness of existing tools is their lack of supporting an integrative representation of transport, transformation as well as biological information processing.
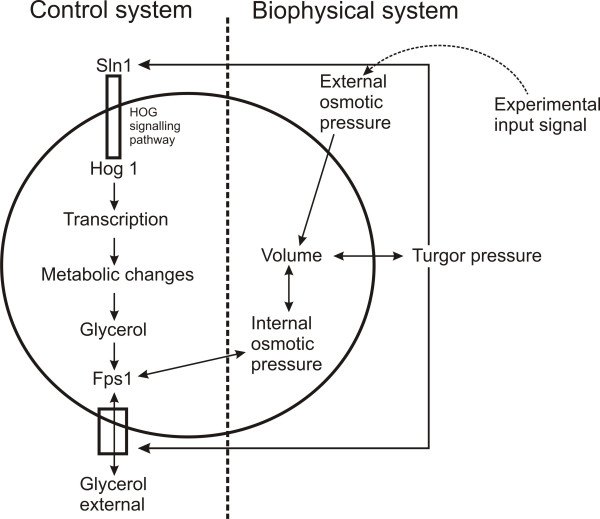
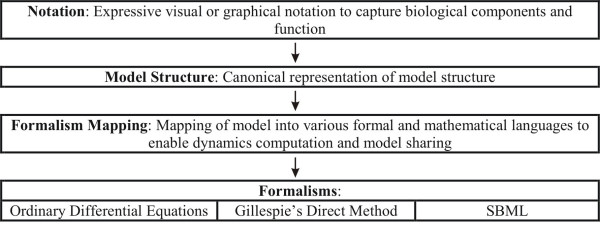
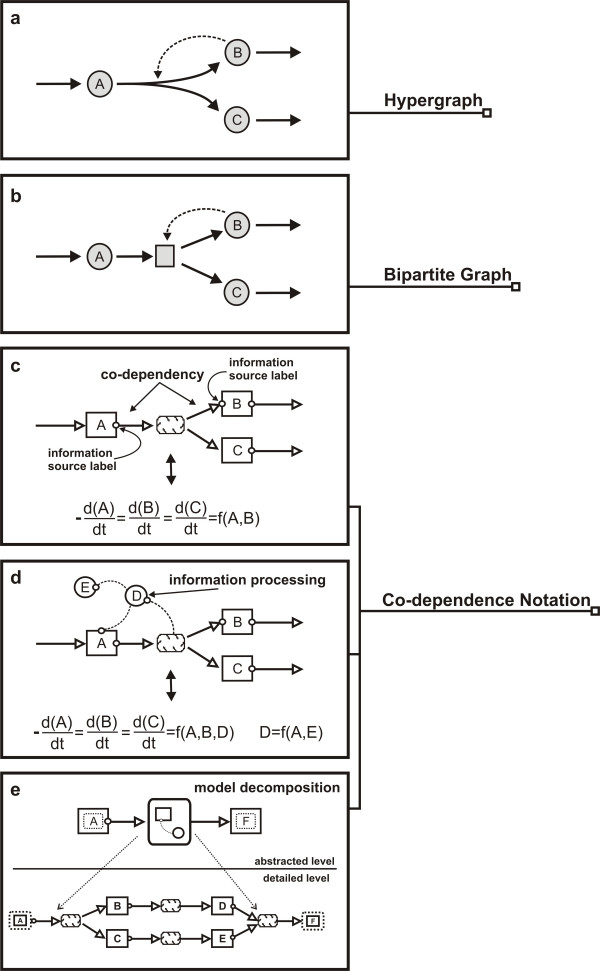
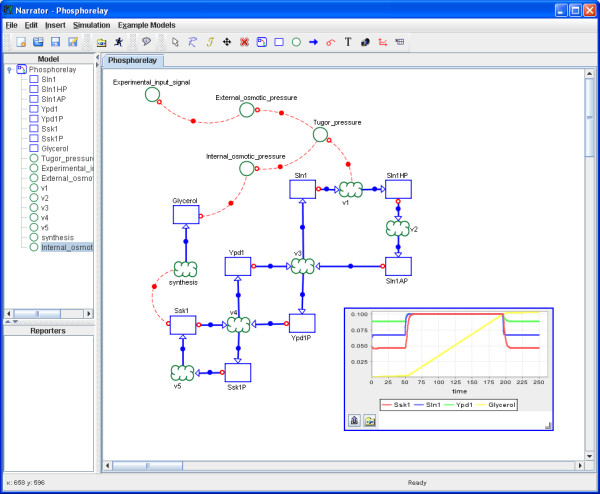
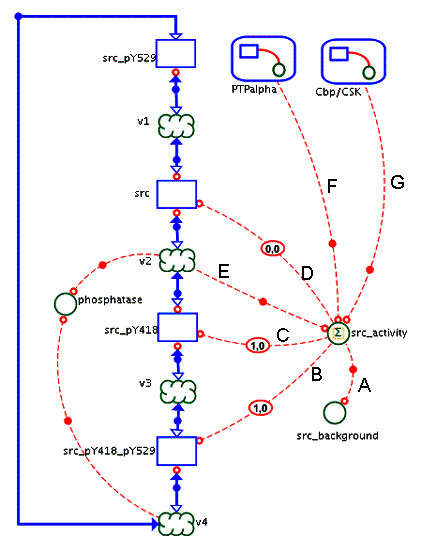
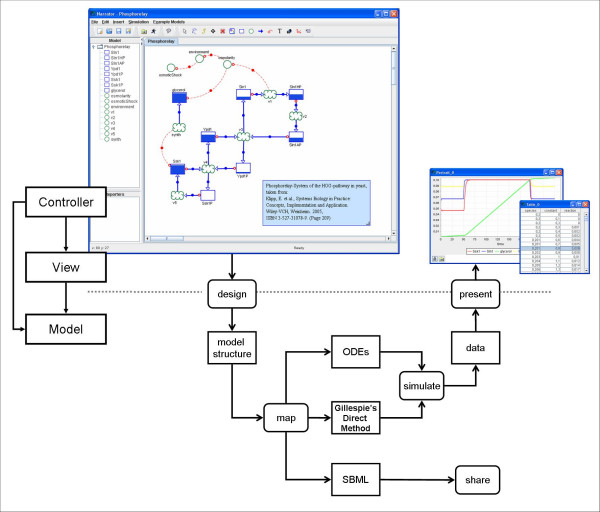
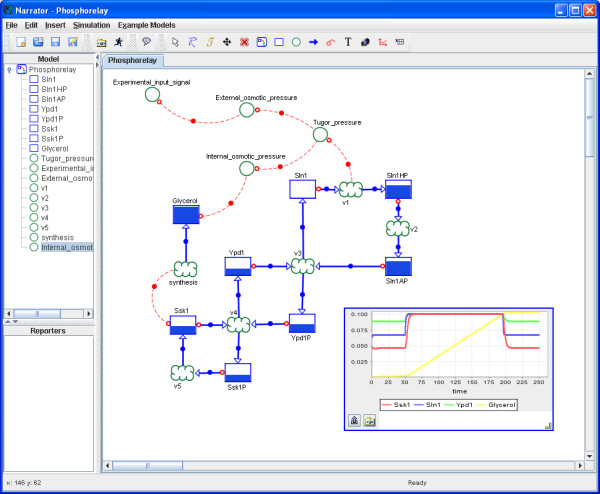
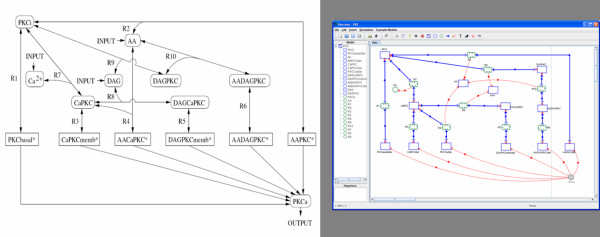
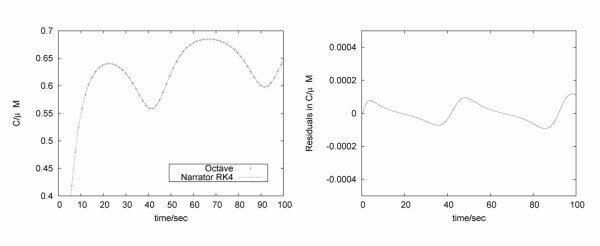
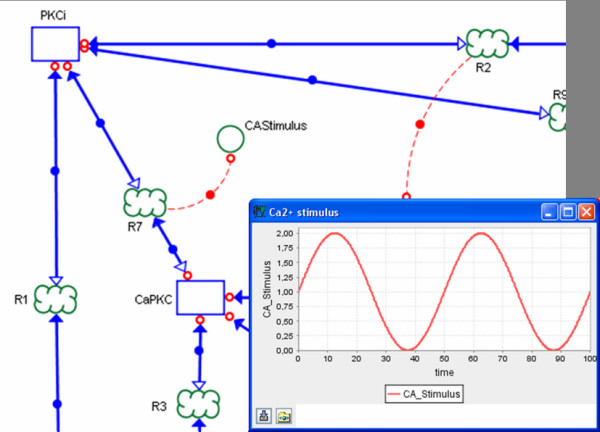
Results: Narrator is a software tool facilitating the development and simulation of biological systems as Co-dependence models. The Co-dependence Methodology complements the representation of species transport and transformation together with an explicit mechanism to express biological information processing. Thus, Co-dependence models explicitly capture, for instance, signal processing structures and the influence of exogenous factors or events affecting certain parts of a biological system or process. This combined set of features provides the system biologist with a powerful tool to describe and explore the dynamics of life phenomena. Narrator's GUI is based on an expressive graphical notation which forms an integral part of the Co-dependence Methodology. Behind the user-friendly GUI, Narrator hides a flexible feature which makes it relatively easy to map models defined via the graphical notation to mathematical formalisms and languages such as ordinary differential equations, the Systems Biology Markup Language or Gillespie's direct method. This powerful feature facilitates reuse, interoperability and conceptual model development.
Conclusion: Narrator is a flexible and intuitive systems biology tool. It is specifically intended for users aiming to construct and simulate dynamic models of biology without recourse to extensive mathematical detail. Its design facilitates mappings to different formal languages and frameworks. The combined set of features makes Narrator unique among tools of its kind. Narrator is implemented as Java software program and available as open-source from http://www.narrator-tool.org.
Figures
Similar articles
-
Presenting and exploring biological pathways with PathVisio.BMC Bioinformatics. 2008 Sep 25;9:399. doi: 10.1186/1471-2105-9-399. BMC Bioinformatics. 2008. PMID: 18817533 Free PMC article.
-
ProteoLens: a visual analytic tool for multi-scale database-driven biological network data mining.BMC Bioinformatics. 2008 Aug 12;9 Suppl 9(Suppl 9):S5. doi: 10.1186/1471-2105-9-S9-S5. BMC Bioinformatics. 2008. PMID: 18793469 Free PMC article.
-
BioNetBuilder: automatic integration of biological networks.Bioinformatics. 2007 Feb 1;23(3):392-3. doi: 10.1093/bioinformatics/btl604. Epub 2006 Nov 30. Bioinformatics. 2007. PMID: 17138585
-
Tools for visually exploring biological networks.Bioinformatics. 2007 Oct 15;23(20):2651-9. doi: 10.1093/bioinformatics/btm401. Epub 2007 Aug 25. Bioinformatics. 2007. PMID: 17720984 Review.
-
Stochastic P systems and the simulation of biochemical processes with dynamic compartments.Biosystems. 2008 Mar;91(3):458-72. doi: 10.1016/j.biosystems.2006.12.009. Epub 2007 Jul 17. Biosystems. 2008. PMID: 17728055 Review.
Cited by
-
Comparative study of three commonly used continuous deterministic methods for modeling gene regulation networks.BMC Bioinformatics. 2010 Sep 14;11:459. doi: 10.1186/1471-2105-11-459. BMC Bioinformatics. 2010. PMID: 20840745 Free PMC article.
-
Sustainable software development in science - insights from 20 years of Vanted.J Integr Bioinform. 2025 Jul 1;22(1):20250007. doi: 10.1515/jib-2025-0007. eCollection 2025 Mar 1. J Integr Bioinform. 2025. PMID: 40586365 Free PMC article.
-
Extended CADLIVE: a novel graphical notation for design of biochemical network maps and computational pathway analysis.Nucleic Acids Res. 2007;35(20):e134. doi: 10.1093/nar/gkm769. Epub 2007 Oct 16. Nucleic Acids Res. 2007. PMID: 17940089 Free PMC article.
-
Interactive Multiresolution Visualization of Cellular Network Processes.iScience. 2020 Jan 24;23(1):100748. doi: 10.1016/j.isci.2019.100748. Epub 2019 Nov 29. iScience. 2020. PMID: 31884165 Free PMC article.
-
Challenges in Reproducibility, Replicability, and Comparability of Computational Models and Tools for Neuronal and Glial Networks, Cells, and Subcellular Structures.Front Neuroinform. 2018 May 1;12:20. doi: 10.3389/fninf.2018.00020. eCollection 2018. Front Neuroinform. 2018. PMID: 29765315 Free PMC article.
References
-
- Systems Biology Markup Language http://www.sbml.org
-
- MathSBML http://sbml.org/software/mathsbml
-
- SBMLmerge Project http://sysbio.molgen.mpg.de/sbmlmerge/index.html
MeSH terms
Substances
LinkOut - more resources
Full Text Sources
