

A comparison of spatial clustering and cluster detection techniques for childhood leukemia incidence in Ohio, 1996-2003
- PMID: 17389045
- PMCID: PMC1851703
- DOI: 10.1186/1476-072X-6-13
A comparison of spatial clustering and cluster detection techniques for childhood leukemia incidence in Ohio, 1996-2003
Abstract
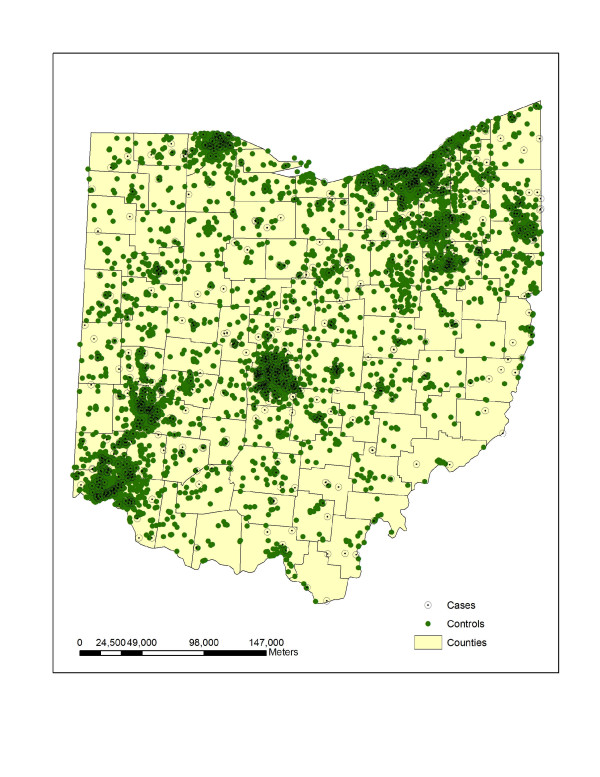
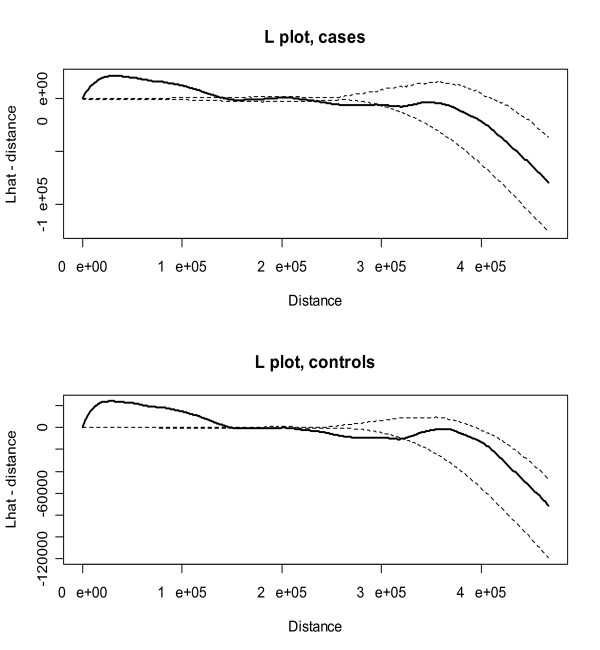
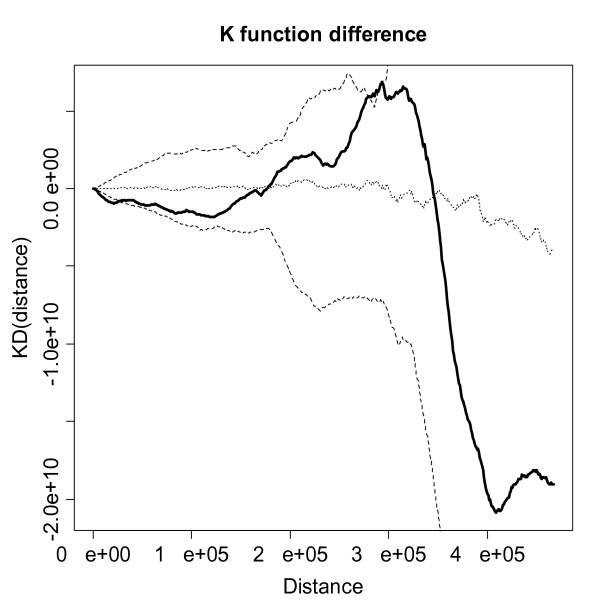
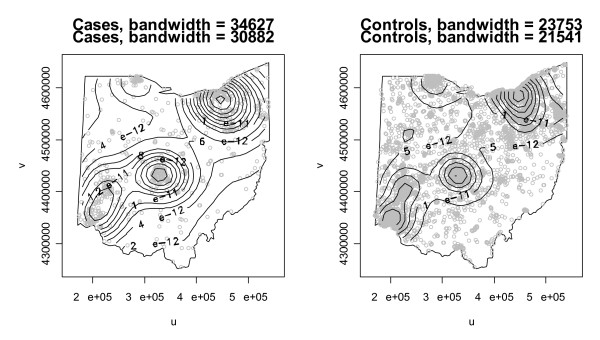
Background: Spatial cluster detection is an important tool in cancer surveillance to identify areas of elevated risk and to generate hypotheses about cancer etiology. There are many cluster detection methods used in spatial epidemiology to investigate suspicious groupings of cancer occurrences in regional count data and case-control data, where controls are sampled from the at-risk population. Numerous studies in the literature have focused on childhood leukemia because of its relatively large incidence among children compared with other malignant diseases and substantial public concern over elevated leukemia incidence. The main focus of this paper is an analysis of the spatial distribution of leukemia incidence among children from 0 to 14 years of age in Ohio from 1996-2003 using individual case data from the Ohio Cancer Incidence Surveillance System (OCISS).Specifically, we explore whether there is statistically significant global clustering and if there are statistically significant local clusters of individual leukemia cases in Ohio using numerous published methods of spatial cluster detection, including spatial point process summary methods, a nearest neighbor method, and a local rate scanning method. We use the K function, Cuzick and Edward's method, and the kernel intensity function to test for significant global clustering and the kernel intensity function and Kulldorff's spatial scan statistic in SaTScan to test for significant local clusters.
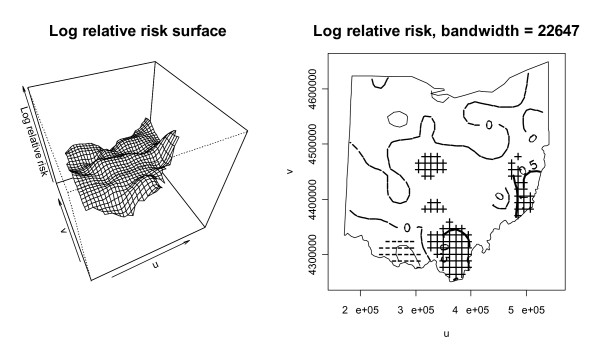
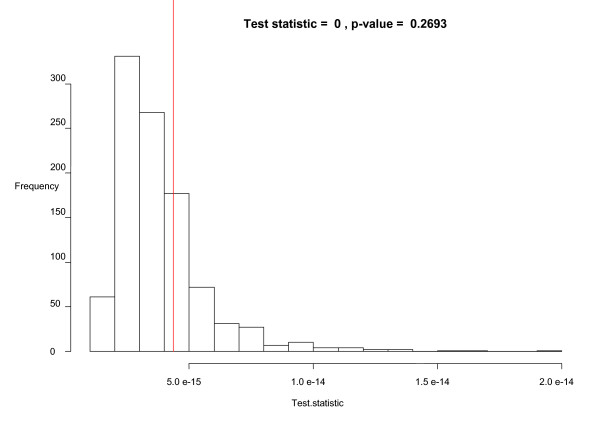
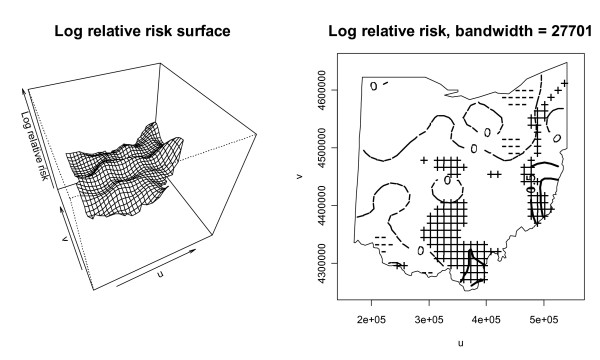
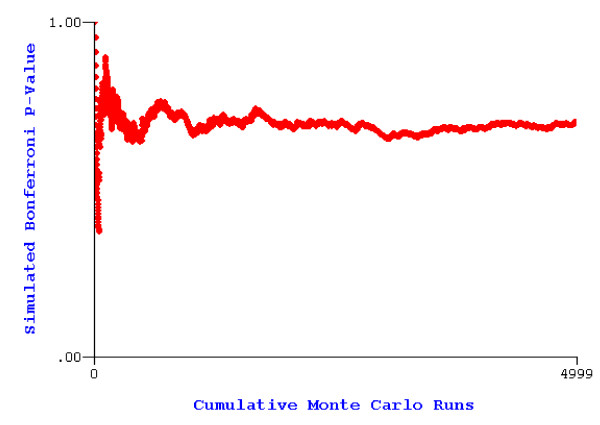
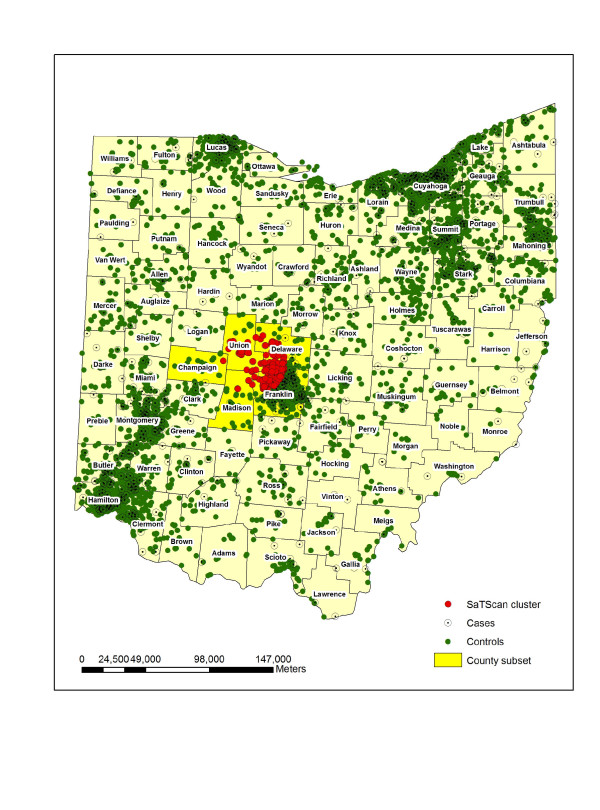
Results: We found some evidence, although inconclusive, of significant local clusters in childhood leukemia in Ohio, but no significant overall clustering. The findings from the local cluster detection analyses are not consistent for the different cluster detection techniques, where the spatial scan method in SaTScan does not find statistically significant local clusters, while the kernel intensity function method suggests statistically significant clusters in areas of central, southern, and eastern Ohio. The findings are consistent for the different tests of global clustering, where no significant clustering is demonstrated with any of the techniques when all age cases are considered together.
Conclusion: This comparative study for childhood leukemia clustering and clusters in Ohio revealed several research issues in practical spatial cluster detection. Among them, flexibility in cluster shape detection should be an issue for consideration.
Figures
Similar articles
-
Spatial variations of childhood acute leukaemia in France, 1990-2006: global spatial heterogeneity and cluster detection at 'living-zone' level.Eur J Cancer Prev. 2012 Jul;21(4):367-74. doi: 10.1097/CEJ.0b013e32834e31d8. Eur J Cancer Prev. 2012. PMID: 22108445
-
Spatial analysis of childhood cancer: a case/control study.PLoS One. 2015 May 20;10(5):e0127273. doi: 10.1371/journal.pone.0127273. eCollection 2015. PLoS One. 2015. PMID: 25992892 Free PMC article.
-
Spatial clustering of childhood leukaemia in Switzerland: A nationwide study.Int J Cancer. 2017 Oct 1;141(7):1324-1332. doi: 10.1002/ijc.30832. Epub 2017 Jun 30. Int J Cancer. 2017. PMID: 28608582
-
Clusters and clustering of childhood cancer: a review.Eur J Epidemiol. 1999 Oct;15(9):847-52. doi: 10.1023/a:1007574016008. Eur J Epidemiol. 1999. PMID: 10608365 Review.
-
Space-time clustering of childhood cancers: a systematic review and pooled analysis.Eur J Epidemiol. 2019 Jan;34(1):9-21. doi: 10.1007/s10654-018-0456-y. Epub 2018 Nov 16. Eur J Epidemiol. 2019. PMID: 30446850 Free PMC article.
Cited by
-
Spatio-temporal epidemiology of the tuberculosis incidence rate in Iran 2008 to 2018.BMC Public Health. 2021 Jun 7;21(1):1093. doi: 10.1186/s12889-021-11157-1. BMC Public Health. 2021. PMID: 34098917 Free PMC article.
-
Evidence of spatial clustering of childhood acute lymphoblastic leukemia cases in Greater Mexico City: report from the Mexican Inter-Institutional Group for the identification of the causes of childhood leukemia.Front Oncol. 2024 Feb 14;14:1304633. doi: 10.3389/fonc.2024.1304633. eCollection 2024. Front Oncol. 2024. PMID: 38420017 Free PMC article.
-
An eight-year snapshot of geospatial cancer research (2002-2009): clinico-epidemiological and methodological findings and trends.Med Oncol. 2011 Dec;28(4):1145-62. doi: 10.1007/s12032-010-9607-z. Epub 2010 Jun 30. Med Oncol. 2011. PMID: 20589539 Review.
-
Comparative Study of Approaches for Detecting Crime Hotspots with Considering Concentration and Shape Characteristics.Int J Environ Res Public Health. 2022 Nov 2;19(21):14350. doi: 10.3390/ijerph192114350. Int J Environ Res Public Health. 2022. PMID: 36361227 Free PMC article.
-
Spatial-temporal analysis of non-Hodgkin lymphoma in the NCI-SEER NHL case-control study.Environ Health. 2011 Jun 30;10:63. doi: 10.1186/1476-069X-10-63. Environ Health. 2011. PMID: 21718483 Free PMC article.
References
Publication types
MeSH terms
LinkOut - more resources
Full Text Sources
Medical
