

doi: 10.1098/rsbl.2007.0109.
Ballooning dispersal in arthropod taxa: conditions at take-off
Affiliations
- PMID: 17389214
- PMCID: PMC2464704
- DOI: 10.1098/rsbl.2007.0109
Item in Clipboard
Ballooning dispersal in arthropod taxa: conditions at take-off
Biol Lett.
.
Abstract
We have solved a long-standing and seemingly paradoxical set of questions that relate to the conditions which govern spider ballooning. We show that observations of spider ballooning excursions are best explained by meteorological conditions which maximize dispersal. Dispersal is predicted to be most effective in terms of distance when the stability of the atmosphere is non-ideally convective and is less effective during purely convective or neutrally stable conditions. Ballooners are most likely to travel a few hundred metres, but dispersal distances of several hundred kilometres are possible.
Figures
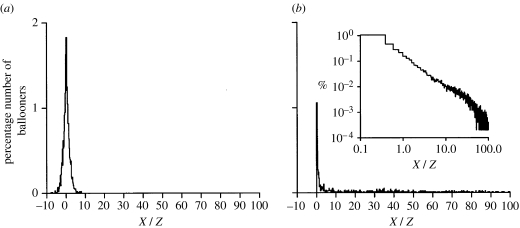
Percentage number of ballooners that are predicted to travel a distance, X, within a (a) purely convective boundary layer with convection velocity scale w*=1 ms−1 and (b) boundary layer of near neutral stability (convective boundary layer with wind shear with friction velocity, u*=1 ms−1, and convective velocity scale, w*=1 ms−1). Predictions are shown on linear–linear and on log–log scales (inset). Ballooners launch into thermals from a height 0.001Z (height of the surface roughness) into boundary layers of depth Z=1000 m. The convective velocity scale w*=(−H*Z)1/3, and consequently w*=1 ms−1, corresponds to a small surface heat flux, H*, of approximately 30 J m−2s−1 (buoyancy flux −103 m2s−3). u*=w*=1 ms−1 corresponds to a mean wind speed (average over the boundary layer) of approximately 12.9 ms−1.
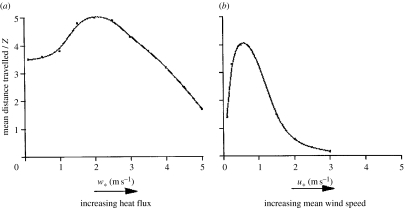
(a) Model predictions for the mean distance travelled by ballooners after launching themselves into thermals from a height 0.001Z and before landing as a function of the convective velocity scale, w*. Predictions are shown for a friction velocity scale u*=0.5 ms−1, which corresponds to mean wind speeds (averaged over the depth of the boundary layer, Z=1000 m) ranging from 6.9 ms−1(w*=0 ms−1) to 2.2 ms−1(w*=5 ms−1). (b) Model predictions for the mean distance travelled by ballooners after lift-off into thermals from a height 0.001Z (height of the surface roughness) and before landing as a function of the friction velocity, u*. Predictions are shown for a convective velocity scale w*=1 ms−1. The predicted mean distance travelled is a maximum when u*≈0.5 ms−1.
References
-
- Aylor D.E, Flesch T.K. Estimating spore release rates using a Lagrangian stochastic simulation model. J. Appl. Meteorol. 2001;40:1196–1208. doi:10.1175/1520-0450(2001)040<1196:ESRRUA>2.0.CO;2 - DOI
-
- Bell J.R, Bohan D.A, Shaw E.M, Weyman G.S. Ballooning dispersal using silk: world fauna, phylogenies, genetics and models. Bull. Entomol. Res. 2005;95:69–114. doi:10.1079/BER2004350 - DOI - PubMed
-
- Brown J.K.M, Hovmoller M.S. Aerial dispersal of pathogens on the global and continental scales and its impact on plant disease. Science. 2002;297:537–541. doi:10.1126/science.1072678 - DOI - PubMed
-
- Burrows F.M. The aerial motion of seeds, fruits, spores and pollen. In: Murray D.R, editor. Seed dispersal. Academic Press; Sydney, Australia: 1986. pp. 1–47.
-
- Businger J.A. A note on the Businger–Dyer profiles. Bound.-Lay. Meteorol. 1988;42:145–151. doi:10.1007/BF00119880 - DOI
Publication types
MeSH terms
LinkOut - more resources
Full Text Sources