. 2007 Mar 26;176(7):979-93.
doi: 10.1083/jcb.200611152.

Linker molecules between laminins and dystroglycan ameliorate laminin-alpha2-deficient muscular dystrophy at all disease stages

Affiliations

Linker molecules between laminins and dystroglycan ameliorate laminin-alpha2-deficient muscular dystrophy at all disease stages

Sarina Meinen et al. J Cell Biol. .

Abstract

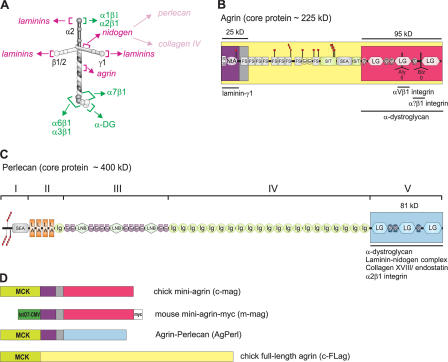
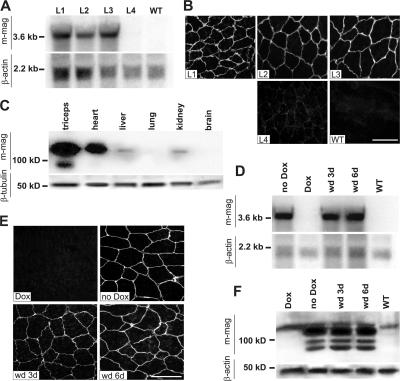
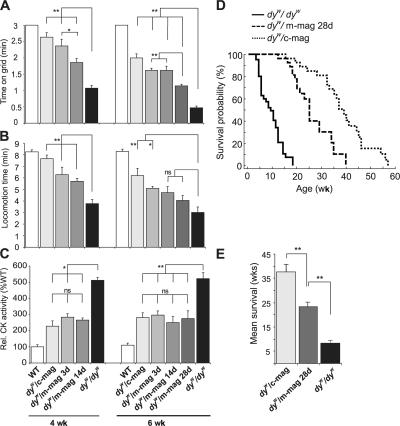
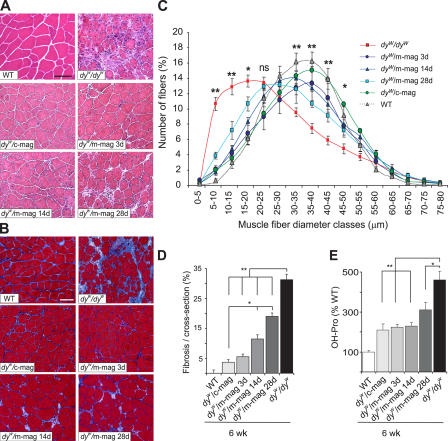
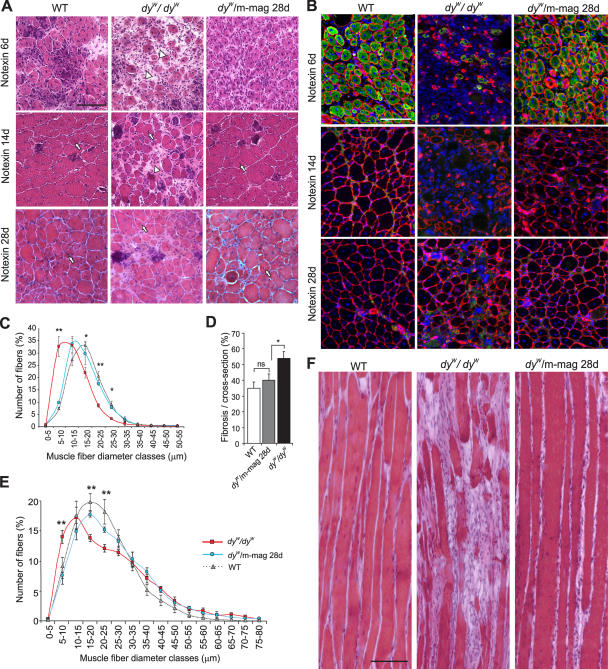
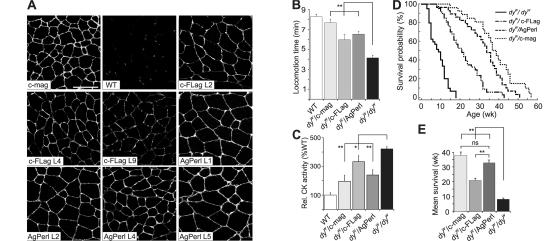
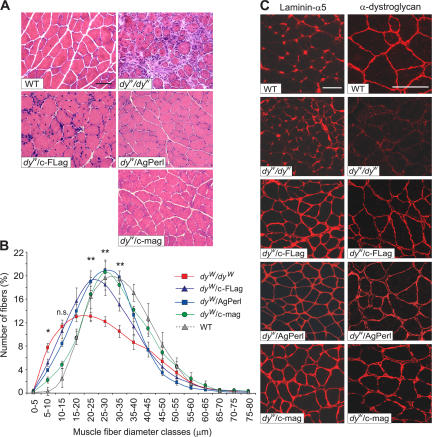
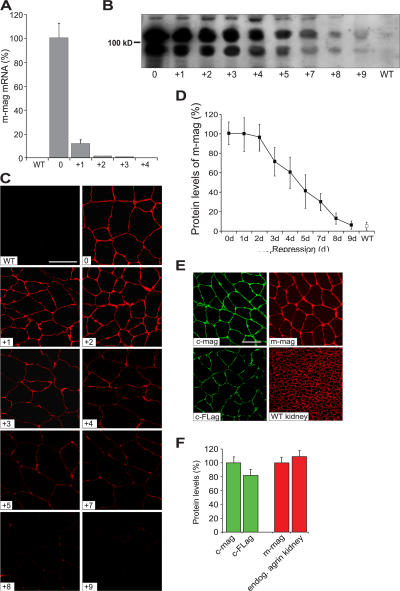
Mutations in laminin-alpha2 cause a severe congenital muscular dystrophy, called MDC1A. The two main receptors that interact with laminin-alpha2 are dystroglycan and alpha7beta1 integrin. We have previously shown in mouse models for MDC1A that muscle-specific overexpression of a miniaturized form of agrin (mini-agrin), which binds to dystroglycan but not to alpha7beta1 integrin, substantially ameliorates the disease (Moll, J., P. Barzaghi, S. Lin, G. Bezakova, H. Lochmuller, E. Engvall, U. Muller, and M.A. Ruegg. 2001. Nature. 413:302-307; Bentzinger, C.F., P. Barzaghi, S. Lin, and M.A. Ruegg. 2005. Matrix Biol. 24:326-332.). Now we show that late-onset expression of mini-agrin still prolongs life span and improves overall health, although not to the same extent as early expression. Furthermore, a chimeric protein containing the dystroglycan-binding domain of perlecan has the same activities as mini-agrin in ameliorating the disease. Finally, expression of full-length agrin also slows down the disease. These experiments are conceptual proof that linking the basement membrane to dystroglycan by specifically designed molecules or by endogenous ligands, could be a means to counteract MDC1A at a progressed stage of the disease, and thus opens new possibilities for the development of treatment options for this muscular dystrophy.


Figures

Figure 1.
Figure 1.
Interactions of laminin-211 and scheme of constructs used in the study. (A) Structure and binding sites of LM-211. Laminins form by coiled-coil interactions of α, β, and γ chains. Interactions of LM-211 and -221 with extracellular matrix components are indicated in red and italics. The main receptors are indicated in green and include different integrins and α-dystroglycan. (B and C) Schematic representation of nonneuronal agrin (B) and perlecan (C). Domain structures and abbreviations are adopted from previous studies (Bezakova and Ruegg, 2003; Iozzo, 2005). The domains included in the constructs used in this study are color-coded, and relevant binding partners are indicated. (D) Schematic presentation of constructs used in the study. Promoters (green), domains (see color code in B and C), and tags are indicated for each construct. MCK represents the 1.3-kb fragment of the human MCK promoter. TetO7-CMV represents the tetracycline-responsive promoter (Fig. S1 A). Fig. S1 is available at http://www.jcb.org/cgi/content/full/jcb.200611152/DC1.
Figure 2.
Figure 2.
Expression of m-mag in transgenic lines. (A) Northern blot analysis of quadriceps and (B) immunostaining of triceps brachii cross sections from transgenic mouse lines 1–4 (L1–L4) and WT mice. Highest expression of m-mag mRNA (∼3.6 kb) and protein was detected in L3. (C) Western blot analyses from different tissues of L3. High levels of m-mag (∼130 kD) were detected in skeletal muscle (triceps brachii) and the heart. Very low levels of m-mag were observed in liver and kidney, but not in lung or brain. (D–F) Expression of m-mag in mouse line L3 is regulated by doxycycline. 5 mg/l doxycycline (Dox) in the drinking water suppresses the expression of m-mag at the transcriptional (D) and protein level (E and F). After withdrawal of doxycycline for 3 d (wd 3d), m-mag is detected, and levels similar to nontreated transgenic mice (no Dox) can be reached after 6 d (wd 6d). Note the lower molecular weight protein bands in (C and F), which are indicative of proteolytic degradation/processing. For normalization, probes for β-actin were used in Northern blot analyses (A and D) and antibodies against β-tubulin and -actin in Western blots (C and F). For quantification see Table I. Bars, 50 μm.
Figure 3.
Figure 3.
Mini-agrin improves overall performance, lowers muscle damage, and prolongs lifespan. Parameters were measured in 4- or 6-wk-old WT, laminin-α2–deficient (dyW/dyW), and laminin-α2–deficient mice expressing m-mag (dyW/m-mag) or c-mag (dyW/c-mag). (A) In grip strength, all mini-agrin–expressing mice show a significant improvement compared with dyW/dyW mice. The improvement is less in mice expressing mini-agrin late (dyW/m-mag 14d or dyW/m-mag 28d). (B) Locomotive activity within 10 min. In 4-wk-old mice, all mini-agrin–expressing mice show a significant improvement compared with dyW/dyW mice. In 6-wk-old mice, only early treatment (dyW/c-mag and dyW/m-mag 3d) is significant. (C) CK levels in the blood. All values are normalized to WT mice. CK activity is reduced to approximately half of that measured in dyW/dyW mice in all mini-agrin–expressing mice, irrespective of the onset of expression. (D and E) Survival curves of mice with different genotypes. Late start of mini-agrin expression (dyW/m-mag 28d) increases the survival probability (D; n ≥ 29) and the mean survival (E; n ≥ 16) more than twice in comparison to dyW/dyW mice. Note that late expression of mini-agrin is significantly less effective than constitutive expression of c-mag (dyW/c-mag mice). All values represent the mean ± the SEM. n ≥ 3. P-values (t test) are as follows: **, P < 0.01; *, P < 0.05; ns (not significant), P > 0.05.
Figure 4.
Figure 4.
Phenotype analysis in triceps brachii muscle of 6-wk-old mice. HE (A) and Masson's Trichrome (B) staining of cross sections. Pathological changes in the muscle of dyW/dyW mice, i.e., fibrosis, variation in muscle fiber diameters, infiltration of nonmuscle tissue, and collagen-containing tissue (blue in B), are less pronounced in mice expressing mini-agrin, but are dependent on the time point of mini-agrin expression. Note that mini-agrin expression does not prevent appearance of polygonally shaped muscle fibers. (C) Muscle fiber size distribution. Values represent relative numbers of fibers in a given diameter class. Muscle fibers of dyW/dyW mice are significantly smaller than age-matched fibers of dyW/dyW mice expressing mini-agrin. (D) Relative contribution of fibrotic regions to the total area in cross sections. In 6-wk-old dyW/dyW mice, the fibrotic tissue represents >30% of the entire muscle. In all the mini-agrin transgenic dyW/dyW mice, the fibrosis is significantly reduced. (E) Relative amount of hydroxyproline (OH-Pro) in muscles of the different genotypes. The amount of OH-Pro is significantly reduced by mini-agrin (dyW/m-mag 3d and 14d, >50%; dyW/m-mag 28d, >30%). Values represent the mean ± the SEM. n ≥ 3. P-values (t test) are as follows: **, P < 0.01; *, P < 0.05; ns, P > 0.05. Bar, 50 μm.
Figure 5.
Figure 5.
Expression of mini-agrin enhances regeneration of skeletal muscle after notexin-induced injury of tibialis anterior muscle. Notexin injection was performed in 5-wk-old mice in which mini-agrin expression had been started 1 wk before. Muscles were analyzed 6 (A and B, notexin 6d; C), 14 (A and B, notexin 14d), and 28 d (A and B, notexin 28d; D–F) after injection. (A) HE-stained cross sections. (B) Staining with the nuclear marker DAPI (blue), antibodies to dMyHC (green), and laminin-γ1 (red) were used to determine the state of regeneration. 6 d after notexin injection, muscle fibers are regenerating in WT and dyW/m-mag 28d mice, while regeneration is poor in dyW/dyW mice; this is indicated by large regions containing mononucleated cells (arrowheads). 14 d after notexin injection, dyW/dyW muscle still contains many mononucleated cells (arrowhead) and little dMyHC is expressed. In WT and dyW/m-mag 28d mice, regeneration has progressed and most of the muscle fibers have lost expression of dMyHC. 28 d after notexin injection, muscle is restored in WT and dyW/m-mag 28d, although centralized nuclei are still present. In dyW/dyW mice, large regions of the muscle fail to regenerate and are replaced by nonmuscle tissue. (C) Fiber size distribution 6 d after notexin injection. Quantification of fibrosis (D) and fiber size distribution 28 d after injection (E). There is a significant difference between dyW/dyW mice and the other two genotypes. (F) HE staining of longitudinal sections of muscles 28 d after notexin injection. DyW/dyW muscle is characterized by extensive fibrosis, and most of the remaining muscle fibers are smaller and thinner than in the other two genotypes. Values represent the mean ± the SEM. n ≥ 3. P-values (t test) are as follows: **, P < 0.01; *, P < 0.05; ns, P > 0.05. Bars, 50 μm.
Figure 6.
Figure 6.
Transgenic expression of c-FLag and an AgPerl fusion protein improves muscle function and lifespan in dyW/dyW mice. (A) Immunostaining of transgenes in triceps brachii muscle of transgenic mouse lines for c-FLag (L2, L4, and L9) or AgPerl (L1, L2, L4, and L5). L4 (c-FLag L4) and L1 (AgPerl L1) express the highest levels for c-FLag and AgPerl fusion construct, respectively. For quantification see Table III. Improvement in locomotion (B) or CK values in the blood (C) is evident for all the transgenic mice at an age of 4 wk. (D and E) Life expectancy. The survival probability (D; n ≥ 29) and the mean survival (E; n ≥ 23) are more than doubled in the transgenic compared with the dyW/dyW mice. Note that in most of the parameters measured there is a trend that the amelioration is less pronounced in dyW/c-FLag mice than in dyW/c-mag or dyW/AgPerl mice. Values in all quantifications represent the mean ± the SEM. n ≥ 3. P-values (t test) are as follows: **, P < 0.01; *, P < 0.05; ns, P > 0.05. Bar, 50 μm.
Figure 7.
Figure 7.
Characterization of muscles from mice transgenic for c-FLag or the AgPerl fusion protein. Animals were analyzed at 4 wk of age. (A) HE staining of triceps brachii cross sections. (B) Muscle fiber size distribution. Values are given as relative number of fibers in each diameter class. Muscles of dyW/dyW mice contain a significantly higher percentage of small fibers. (C) Levels of laminin-α5 (left column) and α-dystroglycan (right column) are increased in muscles of dyW/c-FLag or dyW/AgPerl mice relative to dyW/dyW mice. See Table IV for quantification. Values in all quantifications represent the mean ± the SEM. n ≥ 3. P-values (t test) are as follows: **, P < 0.01; *, P < 0.05; ns, P > 0.05. Bars, 50 μm.
Figure 8.
Figure 8.
Feasibility for the use of mini-agrin or up-regulation of endogenous agrin expression as a treatment option. (A–D) Stability of mini-agrin in skeletal muscle of 4-wk-old transgenic mice. (A) Time course of m-mag transcripts in triceps brachii after repression by 50 mg/liter doxycycline in the drinking water, as determined by quantitative real-time PCR. After 2 d, m-mag transcripts cannot be detected anymore. Concomitantly, mini-agrin protein is lost from the muscle basement, as determined by Western blot analysis from quadriceps (B) and quantitative immunostaining of cross sections from triceps brachii muscle (C). (D) Quantitative immunohistochemistry indicates a half-life of mini-agrin protein of ∼4.5 d. Values are expressed as percentages of staining relative to values before suppression by doxycycline. (E) Staining of transgenic c-mag and c-FLag (left) in triceps brachii muscle using antibodies recognizing chick, but not mouse agrin. Staining using antibodies against mouse agrin in triceps brachii muscle of mice transgenic for m-mag or in kidneys of WT mice (WT kidney; right). Note that staining in green (left) detects only the transgenes, whereas staining in red (right) can detect both the m-mag and endogenous agrin. (F). Quantification of staining intensity. Protein expression levels of c-FLag reach 81% of c-mag (left). Endogenous agrin expression in kidney is 13% higher than the levels of transgenic m-mag in muscle (right). For details see the text and the Materials and methods. Values represent the mean ± the SEM. n ≥ 3. Bar, 50 μm.

Similar articles

Cited by

References

    1. Aumailley, M., L. Bruckner-Tuderman, W.G. Carter, R. Deutzmann, D. Edgar, P. Ekblom, J. Engel, E. Engvall, E. Hohenester, J.C. Jones, et al. 2005. A simplified laminin nomenclature. Matrix Biol. 24:326–332. - PubMed
    1. Bentzinger, C.F., P. Barzaghi, S. Lin, and M.A. Ruegg. 2005. Overexpression of mini-agrin in skeletal muscle increases muscle integrity and regenerative capacity in laminin-alpha2-deficient mice. FASEB J. 19:934–942. - PubMed
    1. Bezakova, G., and M.A. Ruegg. 2003. New insights into the roles of agrin. Nat. Rev. Mol. Cell Biol. 4:295–308. - PubMed
    1. Bezakova, G., J.P. Helm, M. Francolini, and T. Lomo. 2001. Effects of purified recombinant neural and muscle agrin on skeletal muscle fibers in vivo. J. Cell Biol. 153:1441–1452. - PMC - PubMed
    1. Bogdanovich, S., T.O. Krag, E.R. Barton, L.D. Morris, L.A. Whittemore, R.S. Ahima, and T.S. Khurana. 2002. Functional improvement of dystrophic muscle by myostatin blockade. Nature. 420:418–421. - PubMed

Publication types

MeSH terms