. 2007 Apr 16;204(4):771-80.
doi: 10.1084/jem.20061278. Epub 2007 Mar 26.

Lymph node topology dictates T cell migration behavior

Affiliations

Lymph node topology dictates T cell migration behavior

Joost B Beltman et al. J Exp Med. .

Abstract

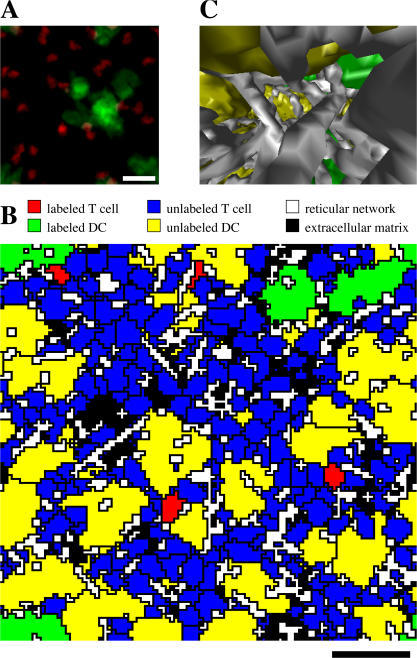
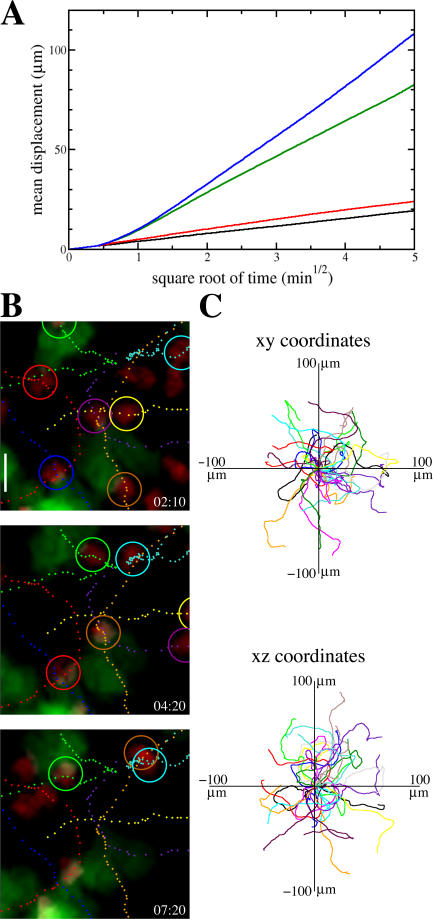
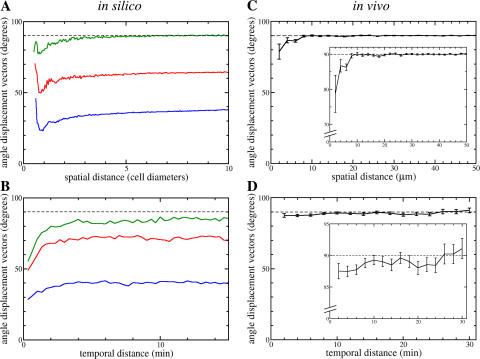
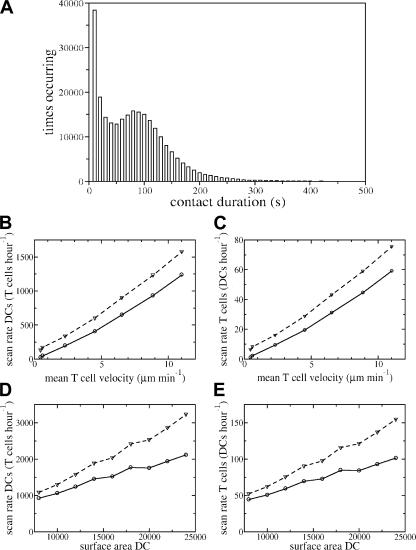
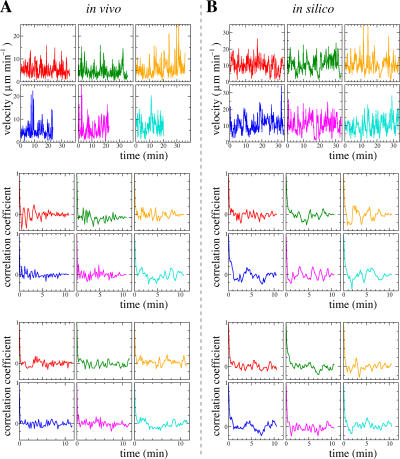
Adaptive immunity is initiated by T cell recognition of foreign peptides presented on dendritic cells (DCs) by major histocompatibility molecules. These interactions take place in secondary lymphoid tissues, such as lymph nodes (LNs) and spleen, and hence the anatomical structure of these tissues plays a crucial role in the development of immune responses. Two-photon microscopy (2PM) imaging in LNs suggests that T cells walk in a consistent direction for several minutes, pause briefly with a regular period, and then take off in a new, random direction. Here, we construct a spatially explicit model of T cell and DC migration in LNs and show that all dynamical properties of T cells could be a consequence of the densely packed LN environment. By means of 2PM experiments, we confirm that the large velocity fluctuations of T cells are indeed environmentally determined rather than resulting from an intrinsic motility program. Our simulations further predict that T cells self-organize into microscopically small, highly dynamic streams. We present experimental evidence for the presence of such turbulent streams in LNs. Finally, the model allows us to estimate the scanning rates of DCs (2,000 different T cells per hour) and T cells (100 different DCs per hour).


Figures

Figure 1.
Figure 1.
Simulated T cells and DCs in a densely packed space. (A) Snapshot with compression along the z direction (top-view) at time 00:00 showing labeled T cells and DCs. (B) Cross section through space at time 18:00 showing all cell types. (C) Three-dimensional snapshot at time 21:39 taken from the viewpoint of a T cell looking in its direction of motion showing RN (gray), labeled DCs (green), and nonlabeled DCs (yellow). Snapshots and cross sections along different directions yield similar pictures. Bars, 20 μm.
Figure 2.
Figure 2.
T cell motion. (A) Mean displacement plots for different update times of the target direction Δt (black line, Δt = 5 s, M3 μm2 min−1; red line, Δt = 10 s, M4 μm2 min−1; green line, Δt = 15 s, M55 μm2 min−1; blue line, Δt = 20 s, M102 μm2 min−1). (B) Sequence of compressions along the z direction (top-view) showing T cell movement over a period of several minutes (time shown in min:s). Tracks of 7 T cells (encircled) are shown at 10-s intervals (DCs green, T cells red). Bar, 10 μm. (C) Overlay of individual T cell tracks from a 10-min period in xy and xz coordinates after aligning their starting positions.
Figure 3.
Figure 3.
T cells travel in streams. The average angle between the displacement vectors of all possible T cell pairs in our simulations (A and B) and in 2PM experiments (C and D) as a function of the spatial (A and C) and temporal (B and D) distance between the members of pairs. Data shown are the average angle per group (bin sizes per panel: 0.05 cell diameters [A], 10 s [B], 2 μm [C], and 2 min [D]), and error bars represent standard error of the mean. Colored lines in in silico data: blue, no rods, 220 DCs, μmax = 4 × 10⁶; red, 1,000 rods, 195 DCs, μmax = 4.5 × 10⁶; green, 3,000 rods, 145 DCs, μmax = 6 × 10⁶.
Figure 4.
Figure 4.
Contact duration and scanning rates. (A) Distribution of contact times measured over all T cells and all DCs. (B–E) Number of T cells that DCs scan per hour (B and D), and number of DCs that T cells scan per hour (C and E) as a function of the T cell velocity (B and C) and of the DC surface area (D and E). Simulations are performed for 15 min. T cell velocity is increased by changing μ from 0 to 6 × 10⁶ with a step size 106 (B and C). In D and E, we change the target surface area of DCs. Dashed lines, total number of cells scanned; solid lines, number of unique cells scanned.
Figure 5.
Figure 5.
T cell velocity fluctuations are environmentally determined. Velocity fluctuations (top) of six real T cells over a 20−40-min period (A) and of six simulated T cells (B). Autocorrelation analyses of the first 64 velocity data points (middle) and of all data points (bottom two panels) are shown.

References

    1. Arstila, T.P., A. Casrouge, V. Baron, J. Even, J. Kanellopoulos, and P. Kourilsky. 1999. A direct estimate of the human αβ T cell receptor diversity. Science. 286:958–961. - PubMed
    1. Keşmir, C., J.A.M. Borghans, and R.J. de Boer. 2000. Diversity of human αβ T cell receptors. Science. 288:1135. - PubMed
    1. Blattman, J.N., R. Antia, D.J. Sourdive, X. Wang, S.M. Kaech, K. Murali-Krishna, J.D. Altman, and R. Ahmed. 2002. Estimating the precursor frequency of naive antigen-specific CD8 T cells. J. Exp. Med. 195:657–664. - PMC - PubMed
    1. Miller, M.J., S.H. Wei, I. Parker, and M.D. Cahalan. 2002. Two-photon imaging of lymphocyte motility and antigen response in intact lymph node. Science. 296:1869–1873. - PubMed
    1. Bousso, P., N.R. Bhakta, R.S. Lewis, and E. Robey. 2002. Dynamics of thymocyte-stromal cell interactions visualized by two-photon microscopy. Science. 296:1876–1880. - PubMed

Publication types