. 2007 Apr 16;204(4):893-906.
doi: 10.1084/jem.20061293. Epub 2007 Mar 26.

NK cell activation in visceral leishmaniasis requires TLR9, myeloid DCs, and IL-12, but is independent of plasmacytoid DCs

Affiliations

NK cell activation in visceral leishmaniasis requires TLR9, myeloid DCs, and IL-12, but is independent of plasmacytoid DCs

Ulrike Schleicher et al. J Exp Med. .

Abstract

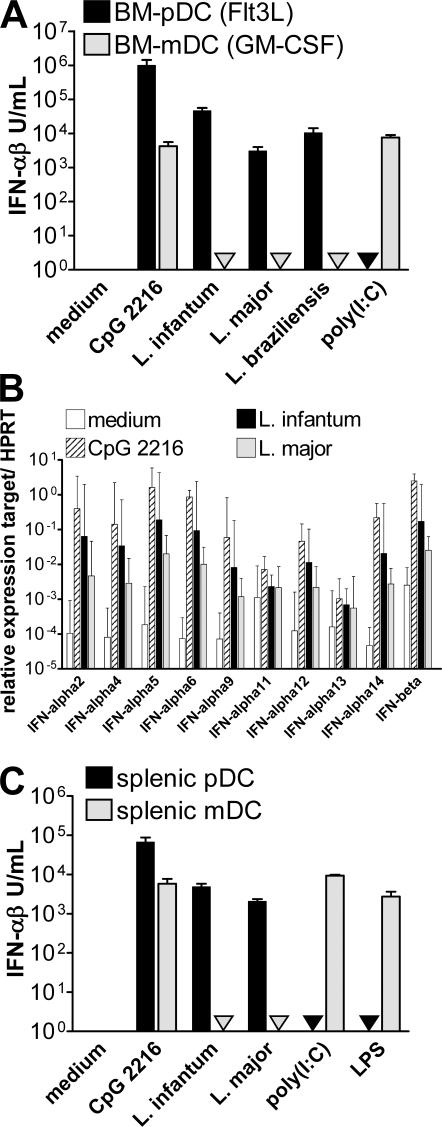
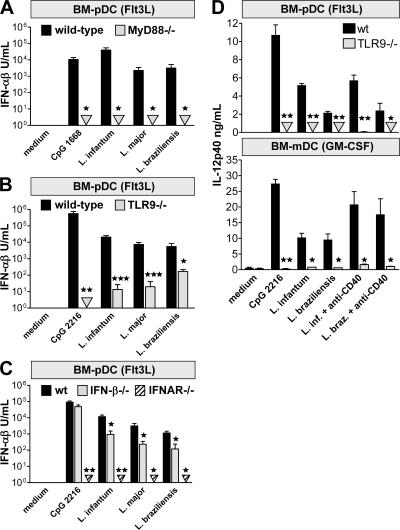
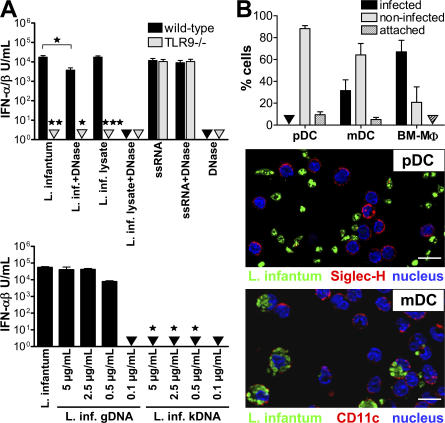
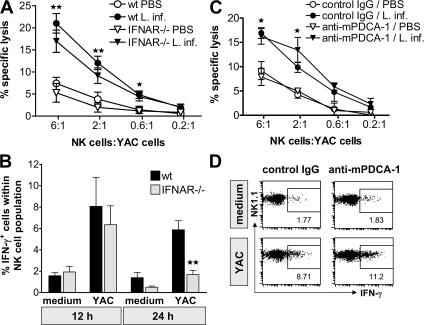
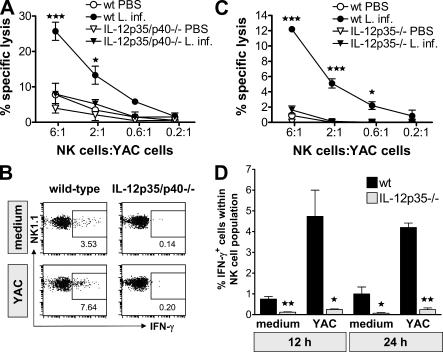
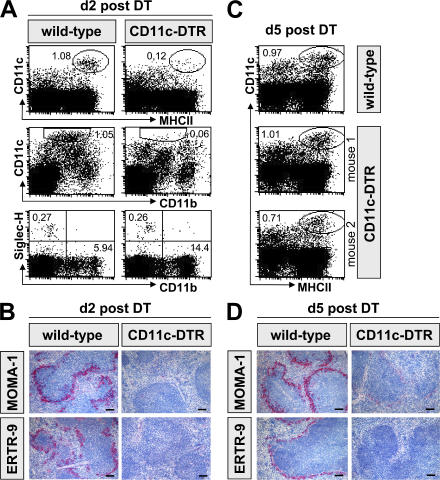
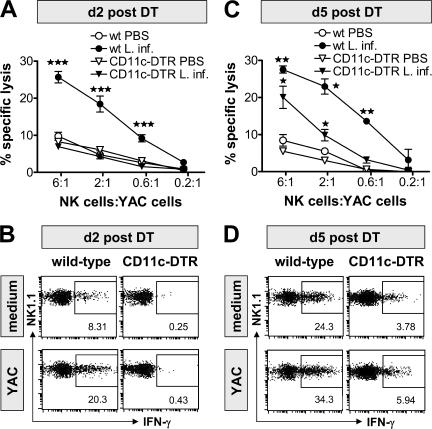
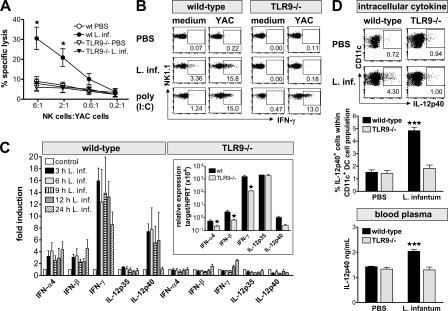
Natural killer (NK) cells are sentinel components of the innate response to pathogens, but the cell types, pathogen recognition receptors, and cytokines required for their activation in vivo are poorly defined. Here, we investigated the role of plasmacytoid dendritic cells (pDCs), myeloid DCs (mDCs), Toll-like receptors (TLRs), and of NK cell stimulatory cytokines for the induction of an NK cell response to the protozoan parasite Leishmania infantum. In vitro, pDCs did not endocytose Leishmania promastigotes but nevertheless released interferon (IFN)-alpha/beta and interleukin (IL)-12 in a TLR9-dependent manner. mDCs rapidly internalized Leishmania and, in the presence of TLR9, produced IL-12, but not IFN-alpha/beta. Depletion of pDCs did not impair the activation of NK cells in L. infantum-infected mice. In contrast, L. infantum-induced NK cell cytotoxicity and IFN-gamma production were abolished in mDC-depleted mice. The same phenotype was observed in TLR9(-/-) mice, which lacked IL-12 expression by mDCs, and in IL-12(-/-) mice, whereas IFN-alpha/beta receptor(-/-) mice showed only a minor reduction of NK cell IFN-gamma expression. This study provides the first direct evidence that mDCs are essential for eliciting NK cell cytotoxicity and IFN-gamma release in vivo and demonstrates that TLR9, mDCs, and IL-12 are functionally linked to the activation of NK cells in visceral leishmaniasis.


Figures

Figure 1.
Figure 1.
IFN-α/β expression in pDCs versus mDCs. Cells were stimulated with 1 μM CpG ODN 2216, 50 ng/ml poly(I:C), 200 ng/ml LPS, L. infantum, L. major, or L. braziliensis promastigotes (MOI = 3) ± anti-mCD40 mAb (5 μg/ml). (A) IFN-α/β production of sorted C57BL/6 BM-pDCs (Flt3L-BM culture) or BM-mDCs (GM-CSF-BM culture) after stimulation for 48 h. Mean ± SEM of two experiments. (B) IFN-α and IFN-β mRNA expression of sorted C57BL/6 BM-pDCs after stimulation for 24 h as determined by real-time RT-PCR. Mean (±SD) of the calculated relative expression of seven independent experiments. (C) IFN-α/β production of purified splenic pDCs or splenic mDCs of 129Sv mice stimulated in parallel. Mean ± SEM of two experiments. ▾, not detectable.
Figure 2.
Figure 2.
Receptors involved in Leishmania-induced expression of IFN-α/β and/or IL-12p40. Sorted BM-pDCs (from Flt3L-BM culture) and sorted immature BM-mDCs (from GM-CSF-BM culture) of C57BL/6 WT, MyD88−/−, TLR9−/−, IFN-β−/−, or IFNAR−/− mice were analyzed. After stimulation with 1 μM CpG ODN 2216, L. infantum, L. major, or L. braziliensis promastigotes (MOI = 3) for 48 h, the (A–C) IFN-α/β content (VSV bioassay) or the (D) IL-12p40 content (ELISA) of the respective culture supernatants was determined. Mean ± SEM of three (A and C), eight (B), or two independent experiments (D). ▾, not detectable. Significant differences between WT and KO cells are indicated as follows: *, P < 0.05; **, P < 0.01; ***, P < 0.005.
Figure 3.
Figure 3.
Parasite requirements for TLR9-dependent Leishmania-specific IFN-α/β production of pDCs. (A) IFN-α/β activity (VSV bioassay) in the culture supernatants of FACS-sorted C57BL/6 or TLR9−/− BM-pDCs stimulated for 48 h with viable L. infantum promastigotes (MOI = 3) in the absence or presence of 500 U/ml DNase I, L. infantum freeze-thaw lysate (MOI = 3, without or with DNase I treatment), 5 μg/ml of synthetic GU-rich ssRNA (without or with DNase I treatment), or 500 U/ml DNase I alone (A, top; mean ± SEM of three experiments) or with L. infantum promastigotes (MOI = 3), L. infantum gDNA, or L. infantum kDNA (A, bottom; mean ± SEM of two experiments). Significant differences (WT vs. KO, gDNA vs. kDNA) are indicated as follows: *, P < 0.05; **, P < 0.01; ***, P < 0.005. (B) C57BL/6 BM-MΦ, sorted BM-mDCs, or sorted C57BL/6 BM-pDCs (from Flt3L-BM culture) were stimulated with L. infantum promastigotes (MOI = 3) for 16 h. After staining of the cell surface (anti-CD11c or anti–Siglec-H) and of the parasites, the number of infected cells, noninfected cells, or cells with attached parasites was determined microscopically by evaluation of at least 100 cells in different visual fields. Mean ± SEM of six (pDCs), four (mDCs), or three (BM-MΦ) separate experiments. Examples of the double immunofluorescence staining of pDCs or mDCs and L. infantum are shown in the lower panels. ▾, not detectable. Bar, 10 μM.
Figure 4.
Figure 4.
Role of IFN-α/β and pDCs for NK cell cytotoxicity and IFN-γ expression in the spleens of mice infected i.v. with 107L. infantum promastigotes. (A and B) C57BL/6 WT versus IFNAR−/− mice. Mean ± SEM of four experiments with one to two mice per time point and mouse group. (C and D) Splenic pDCs of C57BL/6 mice were depleted by injection of 500 μg anti–mPDCA-1 mAb 24 and 4 h before infection with L. infantum. Control mice received rat IgG. Mean ± SEM of three experiments (C) or one of three experiments (D). (A and C) 24 h after injection of PBS or L. infantum, spleen cells were prepared and NK cell cytotoxic activity was measured. Infected WT mice were significantly different from PBS controls (*, P < 0.05; **, P < 0.01), but not from IFNAR−/− or anti–mPDCA-1–treated mice. (B and D) 12 and 24 h after infection, spleen cells were restimulated in medium ± YAC tumor cells (ratio 1:1) and stained for CD3NK1.1+ NK cells and intracellular IFN-γ. **, P < 0.01 WT versus IFNAR−/−.
Figure 5.
Figure 5.
NK cell cytotoxicity and IFN-γ expression in the spleens of C57BL/6 WT versus IL-12p35/p40−/− and BALB/c WT versus IL-12p35−/− mice infected i.v. with 107L. infantum promastigotes. (A and C) 24 h after injection of PBS or L. infantum, spleen cells were prepared and NK cell cytoxic activity was measured. Mean ± SEM of two experiments (two mice/group). (B and D) 12 and 24 h after infection, spleen cells of WT and KO mice were restimulated in medium ± YAC tumor cells (ratio 1:1) and stained for CD3NK1.1+ NK cells and intracellular IFN-γ. One (B) or mean ± SEM (D) of two experiments with one to two mice per time point and mouse group. (A, C, and D) The values obtained for infected WT mice are significantly different from WT PBS controls and from infected KO mice. *, P < 0.05; **, P < 0.01; ***, P < 0.005.
Figure 6.
Figure 6.
Phenotypic analysis of the spleens of C57BL/6 WT and CD11c-DTR/GFP transgenic mice 2 or 5 d after i.p. injection of DT and 12–24 h after i.v. infection with 107L. infantum promastigotes. (A and C) Flow cytometric analysis of DC populations in the spleen. The percentage of the respective cell population is given in the plot panels. (B and D) Immunohistological staining of MZMs (ERTR-9+) and MMs (MOMA-1+) in the spleen. Nuclei were counterstained with Meyer's hemalaun. Bar, 100 μm. (A and B) One of five experiments, with two to three mice per mouse group. (C and D) One of two experiments, with 2–10 mice per mouse group. In C, two individual mice of the group of a total of 10 infected CD11c-DTR/GFP mice with different DC reconstitution are shown.
Figure 7.
Figure 7.
NK cell cytotoxicity and IFN-γ expression in C57BL/6 WT and CD11c-DTR/GFP transgenic mice 2 or 5 d after i.p. injection of DT and 12–24 h after i.v. infection with 107L. infantum promastigotes or injection of PBS. (A) NK cell cytotoxicity of splenocytes at day 2 after DT. Mean ± SEM of five experiments, with two to three mice per time point and mouse group. ***, P < 0.005, WT L. infantum compared with WT PBS and CD11c-DTR L. infantum. (B) Intracellular IFN-γ staining of NK cells (CD3NK1.1+) in splenocytes at day 2 after DT that were restimulated in medium ± YAC tumor cells (ratio 1:1). Staining of individual mice of one experiment is shown (day 5 analysis of the same experiment is illustrated in D). Similar results were obtained in five independent experiments. (C) NK cell cytotoxicity of splenocytes at day 5 after DT. Results of one of two similar experiments are shown, with 2–10 mice per mouse group. *, P < 0.05; **, P < 0.01, WT and CD11c-DTR L. infantum–infected mice compared with the respective PBS control. (D) Intracellular IFN-γ staining of NK cells in splenocytes at day 5 after DT (restimulated as in B). One of two independent experiments.
Figure 8.
Figure 8.
NK cell cytotoxicity, NK cell IFN-γ production, and cytokine expression in the spleens of WT and TLR9−/− mice infected i.v. with 107L. infantum promastigotes. (A) NK cell cytoxicity of splenocytes at 24 h after infection. Mean ± SEM of four independent experiments. *, P < 0.05, WT L. infantum compared with WT PBS or TLR9−/− L. infantum. (B) 12 h after injection of L. infantum, PBS or poly (I:C) (50 μg, i.p.) spleen cells of WT and TLR9−/− mice were restimulated in medium ± YAC tumor cells (ratio 1:1) and stained for NK cells (CD3NK1.1+) and intracellular IFN-γ. One of three similar experiments. (C) IFN-α4, IFN-β, IFN-γ, IL-12p35, and IL12p40 mRNA expression in the spleens 3, 6, 9, 12, and 24 h after infection. PBS control mice were set as 1 (mean ± SEM of three experiments; in each experiment two mice per time point and mouse group were analyzed by real-time RT-PCR with triplicate determinations for each gene). Inset: Relative cytokine mRNA expression levels (compared with the mHPRT-1 housekeeping gene) in the spleen 6 h after infection (mean ± SEM of three experiments). (D) Top panels: 12 h after injection of PBS or L. infantum, spleen cells of WT and TLR9−/− mice were restimulated in medium and stained for CD11c+ DCs and intracellular IL-12p40 protein (one of three similar experiments; the percentage of IL-12p40+ cells is indicated in the panels; mean ± SEM of three independent experiments is shown in the graph below). ***, P < 0.001, WT L. infantum compared with WT PBS and TLR9−/− L. infantum. Bottom: IL-12p40 plasma levels of 12-h–infected or PBS control mice as measured by ELISA (mean ± SEM of three independent experiments). ***, P < 0.001, WT L. infantum compared with WT PBS and TLR9−/− L. infantum.

Similar articles

Cited by

References

    1. French, A.R., and W.M. Yokoyama. 2003. Natural killer cells and viral infections. Curr. Opin. Immunol. 15:45–51. - PubMed
    1. Korbel, D.S., O.C. Finney, and E.M. Riley. 2004. Natural killer cells and innate immunity to protozoan pathogens. Int. J. Parasitol. 34:1517–1528. - PubMed
    1. Martin-Fontecha, A., L.L. Thomsen, S. Brett, C. Gerard, M. Lipp, A. Lanzavecchia, and F. Sallusto. 2004. Induced recruitment of NK cells to lymph nodes provides IFN-γ for Th1 priming. Nat. Immunol. 5:1260–1265. - PubMed
    1. Laouar, Y., F.S. Sutterwala, L. Gorelik, and R.A. Flavell. 2005. Transforming growth factor-b controls T helper type 1 cell development through regulation of natural killer cell interferon-γ. Nat. Immunol. 6:600–607. - PubMed
    1. Moretta, A. 2002. Natural killer cells and dendritic cells: rendezvous in abused tissues. Nat. Rev. Immunol. 2:957–963. - PubMed

Publication types

MeSH terms