. 2007 Apr;129(4):267-83.
doi: 10.1085/jgp.200609656.

Alteration of epithelial structure and function associated with PtdIns(4,5)P2 degradation by a bacterial phosphatase

Affiliations

Alteration of epithelial structure and function associated with PtdIns(4,5)P2 degradation by a bacterial phosphatase

David Mason et al. J Gen Physiol. 2007 Apr.

Abstract

Elucidation of the role of PtdIns(4,5)P(2) in epithelial function has been hampered by the inability to selectively manipulate the cellular content of this phosphoinositide. Here we report that SigD, a phosphatase derived from Salmonella, can effectively hydrolyze PtdIns(4,5)P(2), generating PtdIns(5)P. When expressed by microinjecting cDNA into epithelial cells forming confluent monolayers, wild-type SigD induced striking morphological and functional changes that were not mimicked by a phosphatase-deficient SigD mutant (C462S). Depletion of PtdIns(4,5)P(2) in intact SigD-injected cells was verified by detachment from the membrane of the pleckstrin homology domain of phospholipase Cdelta, used as a probe for the phosphoinositide by conjugation to green fluorescent protein. Single-cell measurements of cytosolic pH indicated that the Na(+)/H(+) exchange activity of epithelia was markedly inhibited by depletion of PtdIns(4,5)P(2). Similarly, anion permeability, measured using two different halide-sensitive probes, was depressed in cells expressing SigD. Depletion of PtdIns(4,5)P(2) was associated with marked alterations in the actin cytoskeleton and its association with the plasma membrane. The junctional complexes surrounding the injected cells gradually opened and the PtdIns(4,5)P(2)-depleted cells eventually detached from the monolayer, which underwent rapid restitution. Similar observations were made in intestinal and renal epithelial cultures. In addition to its effects on phosphoinositides, SigD has been shown to convert inositol 1,3,4,5,6-pentakisphosphate (IP(5)) into inositol 1,4,5,6-tetrakisphosphate (IP(4)), and the latter has been postulated to mediate the diarrhea caused by Salmonella. However, the effects of SigD on epithelial cells were not mimicked by microinjection of IP(4). In contrast, the cytoskeletal and ion transport effects were replicated by hydrolyzing PtdIns(4,5)P(2) with a membrane-targeted 5-phosphatase or by occluding the inositide using high-avidity tandem PH domain constructs. We therefore suggest that opening of the tight junctions and inhibition of Na(+)/H(+) exchange caused by PtdIns(4,5)P(2) hydrolysis combine to account, at least in part, for the fluid loss observed during Salmonella-induced diarrhea.


Figures
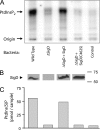
Figure 1.
Figure 1.
Generation of PtdIns(5)P by SigD. HeLa cells were infected with the indicated strains of Salmonella and, after 10 min at 37°C, the reaction was stopped and lipids were extracted as described in Materials and methods. The PtdIns(5)P content was next analyzed by its enzymatic conversion to radiolabeled PtdIns(4,5)P2 by insertion of the gamma phosphate of [32P]ATP, catalyzed by the type II phosphoinositide kinase, which selectively phosphorylates the 4′-position of PtdIns(5)P. The resulting lipids were next separated by thin layer chromatography. A representative chromatogram is shown in A. The site where the lipid mixture was spotted (Origin) and the position of the PtdIns(4,5)P2 produced are indicated. The cells were infected, from left to right, with wild-type Salmonella, SigD-deficient Salmonella, SigD-deficient Salmonella bearing a plasmid expressing wild-type SigD cDNA, and SigD-deficient Salmonella bearing a plasmid expressing the catalytically inactive SigD mutant SigD (C462S). Lipids from uninfected cells are shown in the last lane. The deletion of SigD and the level of expression of the retransformed wild-type and mutant SigD were verified by immunoblotting. Identical amounts of bacteria were loaded, and lanes from the same gel and exposure are shown in B, which is representative of two similar blots. Lanes were separated in the image to facilitate alignment with the TLC (above) and bar graph (below). Molecular mass markers (in kD) are shown to the right. In C the amount of PtdIns(4,5)P2 present in each TLC sample was quantified by HPLC and online continuous-flow liquid-scintillation counting. The chromatogram and quantitation shown are representative of three similar independent experiments.
Figure 2.
Figure 2.
Effect of SigD on PtdIns(4,5)P2 distribution and cellular morphology. Intestinal epithelial cells (IEC-18) were microinjected with cDNA encoding PLCδ-PH-GFP only (AC), or together with either wild-type SigD (DF) or SigD (C462S) cDNA (GI). Cells were then incubated for 3 h at 37°C before imaging by confocal (A, D, and G), differential interference contrast (DIC; B, E, and H), or conventional epifluorescence microscopy (C, F and I). A, D, and G illustrate representative x vs. y confocal slices acquired near the middle of the cell, while A′, D′, and G′ are the corresponding x vs. z reconstructions. The DIC images in B, E, and H correspond to the cells in C, F, and I, respectively. The images are representative of at least 10 similar experiments of each type. Bar, 10 μm.
Figure 3.
Figure 3.
Time course of the effects of PtdIns(4,5)P2 depletion on epithelial morphology. Epithelial cells grown to confluence were used for microinjection of PLCδ-PH-GFP and SigD cDNA (1:5 ratio). Wild-type SigD was used in A–D and F–I, while SigD (C462S) was used in E and J. DIC and epifluorescence images were acquired with the focal plane near the apical surface of the cells (A–E) or ≈10 μm above the apical membrane (F–J). The images shown are representative of at least five similar experiments. Bar, 10 μm.
Figure 4.
Figure 4.
Effect of PtdIns (4,5)P2 depletion on F-actin and PtdIns(4,5)P2 distribution. Intestinal epithelial cells (IEC-18) were microinjected with PLCδ-PH-GFP and SigD cDNA (1:5 ratio). The monolayers were incubated for varying periods of time and were then fixed, permeabilized, and stained with rhodamine-phalloidin to reveal F-actin. The stained cells were then analyzed by confocal fluorescence microscopy. Panels A–F show PLCδ-PH-GFP in green and F-actin in red. Panels A′–F′ show only F-actin in white. Panels A, A′, C, C′, E, and E′ illustrate representative x vs. y confocal slices acquired near the middle of the cell, while B, B′, D, D′, F, and F′ are the corresponding x vs. z reconstructions. A and B are representative of cells fixed at an early stage, i.e., 2–4 h after injection. C and D are representative of cells fixed at an intermediate stage, i.e., 4–5 h after injection. E and F are representative of cells fixed at a late stage, i.e., 5–6 h after injection. The images shown are representative of 10 similar experiments of each type. Bar, 10 μm.
Figure 5.
Figure 5.
Alternative means of regulating PtdIns(4,5)P2. IEC-18 cells were microinjected with cDNA encoding for (A–C) the phosphatase domain of synaptojanin-2 fused to a CAAX box (PD-CAAX), or (D–F) two tandem copies of the PH domain from PLCδ-PH fused to GFP (see Materials and methods for details regarding use and construction). In A, the PD-CAAX DNA was coexpressed with the PLCδ-PH-GFP to identify transfected cells and to ensure the PtdIns(4,5)P2 hydrolysis occurred. (A and D) Green fluorescence; (B and E) DIC images. The cell in D corresponds to E; (C and F) actin staining using phalloidin. Arrows indicate injected cells.
Figure 6.
Figure 6.
Effect of PtdIns(4,5) P2 depletion on junctional integrity. Intestinal epithelial cells (IEC-18) were either untreated (A) or were microinjected with PM-GFP, a fluorescent microinjection and expression marker together with SigD cDNA (B and C). The monolayer was incubated for 2 h to allow expression and then fixed, permeabilized, and stained with antibodies to ZO-1, followed by Cy3-coupled secondary antibodies. The cells were the analyzed by fluorescence microscopy. Red fluorescence is shown in A and C and green in B. Arrows point to regions where junctional staining is discontinuous. Images are representative of five similar experiments. Bar, 10 μm.
Figure 7.
Figure 7.
Effect of PtdIns(4,5)P2 depletion on anion permeability. (A and B) IEC-18 cells were microinjected with YFP(H148Q), a halide-sensitive fluorescent protein with or without wild-type SigD cDNA. The cells were allowed to express the fluorescent probe for 2 h and subjected to digital imaging for assessment of halide permeability as described under Materials and methods. (A) Representative experiment. The emission of YFP(H148Q) is shown over time in a cell not expressing SigD. Where indicated, the concentration of chloride in the bathing medium was reduced by isoosmotic replacement with iodide. For calibration, the cells were permeabilized using tributyltin (TBT) and nigericin. (B) Quantitation of relative chloride permeability in cells expressing either YFP(H148Q) alone (control) or in combination with SigD. The rate of change of the fluorescence over time (ΔF/t) was calculated following reduction of chloride to 0 mM by isoosmotic replacement with iodide. To allow comparison between experiments the fluorescence was normalized to the initial (maximal) value. Data are means ± SEM of 11 individual cells from three separate experiments. (C and D) Cells were microinjected with SigD cDNA as above or alternatively with the PD-CAAX construct and subsequently loaded hypotonically with MQAE as detailed in Materials and methods. Following a 30-min recovery period, the chloride concentration was manipulated using nitrate as a substitute and calibrated as in A. (D) Quantitation of the rate of change of MQAE fluorescence over time in control cells (open bar) with SigD (filled bar) or with PD-CAAX (gray bar). Data are means ± SEM of 121 cells from three separate experiments.
Figure 8.
Figure 8.
Effect of PtdIns(4,5)P2 depletion pH regulation. To measure pH, IEC-18 cells were microinjected with YFP cDNA with or without wild-type SigD cDNA. The cells were allowed to express the proteins for 2 h. Alternatively, cells microinjected with PLCδ-PH-GFP with or without wild-type SigD or PD-CAAX cDNA were loaded with SNARF-5F during the final 30 min of the expression period. The cells were then subjected to digital imaging for assessment of cytosolic pH, as described under Materials and methods. (A) To define the functional contribution of individual NHE isoforms, the rate of pH recovery was measured in SNARF-5F–loaded cells treated with the indicated inhibitors. From left: untreated cells; cells treated with 1 μM HOE694 (expected to inhibit NHE1 almost exclusively); cells treated with 20 μM HOE694 (expected to inhibit both NHE1 and NHE2); cells treated with 20 μM HOE694 plus 5 μM S3226 (expected to inhibit NHE1, NHE2 and NHE3). (B) Representative experiment showing pH recovery from an acid load in YFP (solid triangles) and YFP plus SigD-expressing cells (open circles). The emission of YFP was calibrated using nigericin and potassium, and the pH determined from such calibrations is shown over time. The cells were prepulsed with ammonium to induce cytosolic acidification upon its removal. Where indicated, sodium in the bathing medium was replaced isoosmotically by potassium and vice versa. (C) Quantitation of relative Na+/H+ exchange activity of control, SigD-expressing, or PD-CAAX–expressing cells. Activity was measured as the rate of sodium-induced pH recovery, measured over the first 1–2 min. Data show rates of alkalinization and are means ± SEM of at least three experiments of each type.

Similar articles

Cited by

References

    1. Aharonovitz, O., H.C. Zaun, T. Balla, J.D. York, J. Orlowski, and S. Grinstein. 2000. Intracellular pH regulation by Na+/H+ exchange requires phosphatidylinositol 4,5-bisphosphate. J. Cell Biol. 150:213–224. - PMC - PubMed
    1. Baumgartner, M., H. Patel, and D.L. Barber. 2004. Na+/H+ exchanger NHE1 as plasma membrane scaffold in the assembly of signaling complexes. Am. J. Physiol. Cell Physiol. 287:C844–C850. - PubMed
    1. Bertelsen, L.S., G. Paesold, S.L. Marcus, B.B. Finlay, L. Eckmann, and K.E. Barrett. 2004. Modulation of chloride secretory responses and barrier function of intestinal epithelial cells by the Salmonella effector protein SigD. Am. J. Physiol. Cell Physiol. 287:C939–C948. - PubMed
    1. Botelho, R.J., M. Teruel, R. Dierckman, R. Anderson, A. Wells, J.D. York, T. Meyer, and S. Grinstein. 2000. Localized biphasic changes in phosphatidylinositol-4,5-bisphosphate at sites of phagocytosis. J. Cell Biol. 151:1353–1368. - PMC - PubMed
    1. Bretscher, A., K. Edwards, and R.G. Fehon. 2002. ERM proteins and merlin: integrators at the cell cortex. Nat. Rev. Mol. Cell Biol. 3:586–599. - PubMed

Publication types

MeSH terms