. 2007 Apr;129(4):317-29.
doi: 10.1085/jgp.200709756.

Uncoupling and turnover in a Cl-/H+ exchange transporter

Affiliations

Uncoupling and turnover in a Cl-/H+ exchange transporter

Michael Walden et al. J Gen Physiol. 2007 Apr.

Abstract

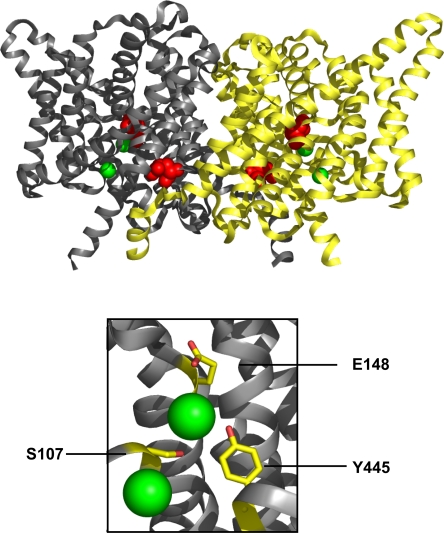
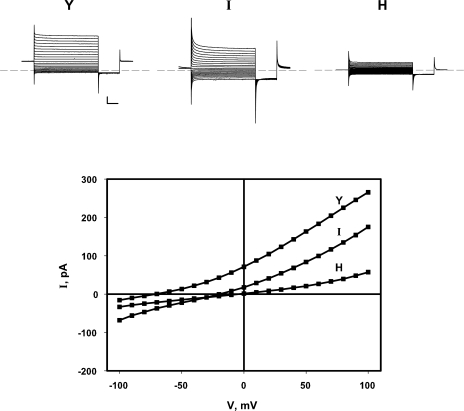
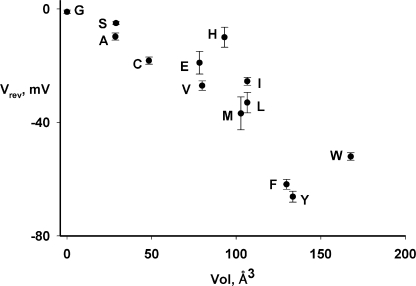
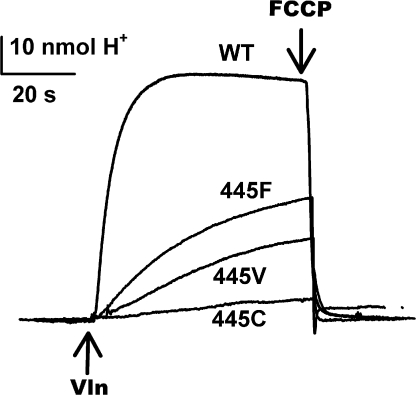
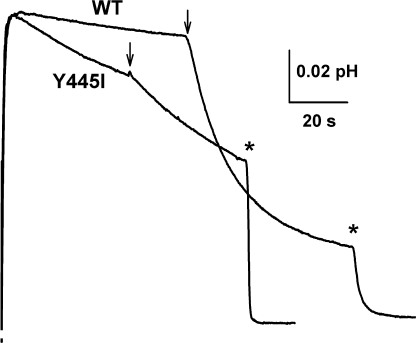
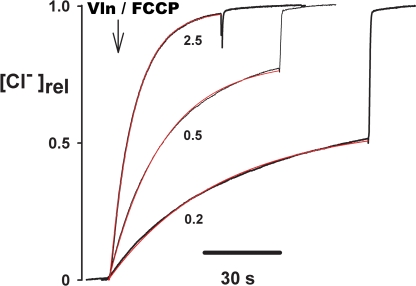
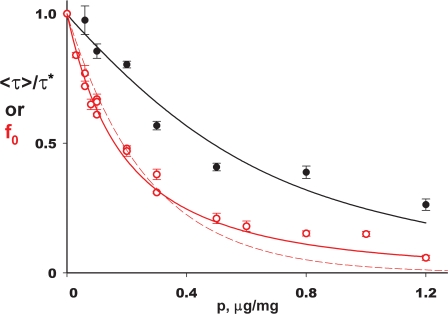
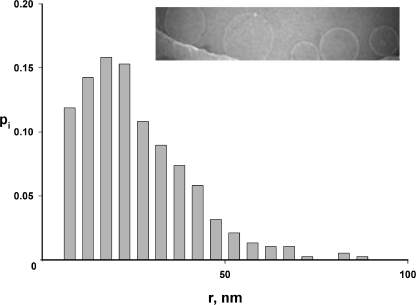
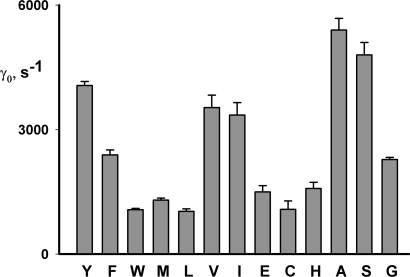
The CLC-family protein CLC-ec1, a bacterial homologue of known structure, stoichiometrically exchanges two Cl(-) for one H(+) via an unknown membrane transport mechanism. This study examines mutations at a conserved tyrosine residue, Y445, that directly coordinates a Cl(-) ion located near the center of the membrane. Mutations at this position lead to "uncoupling," such that the H(+)/Cl(-) transport ratio decreases roughly with the volume of the substituted side chain. The uncoupled proteins are still able to pump protons uphill when driven by a Cl(-) gradient, but the extent and rate of this H(+) pumping is weaker in the more uncoupled variants. Uncoupling is accompanied by conductive Cl(-) transport that is not linked to counter-movement of H(+), i.e., a "leak." The unitary Cl(-) transport rate, measured in reconstituted liposomes by both a conventional initial-velocity method and a novel Poisson dilution approach, is approximately 4,000 s(-1) for wild-type protein, and the uncoupled mutants transport Cl(-) at similar rates.


Figures

Figure 1.
Figure 1.
Structure of CLC-ec1. The homodimeric protein, with each subunit in its own color, is shown viewed from the membrane, extracellular side up. Bound Cl ions are green spheres, and the extracellular and intracellular proton-transfer glutamates are space filled in red. Blowup of boxed region is shown below, with crucial residues in the Cl pathway indicated.
Figure 2.
Figure 2.
pH-induced reversal potential shifts for Y445 variants. Currents arising from CLC-ec1 variants with the indicated amino acid at position 445 were measured in planar bilayers in the presence of a 4-unit pH gradient (pH 3/pH 7). Top panels, voltage pulses from a holding voltage of zero to command voltages of −100 to +100 mV were applied for 3 s, followed by a 1-s tail pulse to −100 mV. Scale bars represent 50 pA, 500 ms. Bottom panel, I-V curves derived from these traces.
Figure 3.
Figure 3.
Correlation of H+/Cl coupling ratio with side chain volume. Reversal potential Vrev produced by a 4-unit pH gradient at symmetrical 300 mM Cl is plotted against the volume of the side chain (Zamyatin, 1972) at position 445 (mean ± SEM of three to five measurements in separate bilayers).
Figure 4.
Figure 4.
Cl-driven H+ pumping by Y445 mutants. Proton uptake against a pH gradient, driven by outwardly directed Cl− gradient was assayed in liposomes reconstituted with the indicated CLC-ec1 variants. Traces of external pH are shown. Uptake was initiated by Vln addition and reversed by FCCP.
Figure 5.
Figure 5.
Conductive leak in a partially uncoupled mutant. Liposomes reconstituted with WT or Y445I were suspended in 300 mM KCl solution at pH 4.5. Proton efflux was initiated by raising pH to 6.5, and pH of the suspension was monitored. Valinomycin was added at arrows and FCCP at asterisks. Downward deflection indicates acidification of the suspension.
Figure 6.
Figure 6.
The “Cl-dump” experiment: raw traces. Liposomes reconstituted with CLC-ec1 at the indicated protein density (μg/mg) and loaded with 300 mM Cl were suspended in 1 mM Cl medium, and external Cl concentration was monitored. Efflux was initiated by addition of Vln + FCCP . After most of the transporting liposomes had dumped their Cl, detergent was added to release Cl from the entire population of liposomes. Released Cl is shown normalized to the fully dumped value. Experimental time courses (black traces) are fit with exponentials (red) as described in Materials and methods.
Figure 7.
Figure 7.
Kinetics of Cl− transport by CLC-ec1 Cl−-dump experiments as in Fig 6 were analyzed in two different ways. (A) Initial-velocity method. Initial rate of Cl− efflux was determined as a function of protein density p in the reconstitution mix. These experiments employed protein densities <0.5 μg/mg, where the plot is linear and initial rates can be measured accurately. Each point represents a single time course. The regression line represents a unitary turnover rate of 4,060 s−1. (B) Poisson method. The "average time constant" 〈τ〉 for CLC-mediated Cl− transport was measured by fitting Cl− efflux traces at the indicated protein densities. Each point represents three to four measurements. Solid curve is fit to the data according to Eq. 7, using nine terms in the infinite sum. The fit value of the 〈τ〉 intercept τ* is 54.3 s, and of p0, which gives the initial slope of the curve, is 0.19 μg/mg.
Figure 8.
Figure 8.
Covariation of Poisson transport parameters. Average time constant 〈τ〉 normalized to its zero-protein value τ* (black points) and f0 (red points) are plotted against protein density. Solid black curve for time constant is according to Eq. 7. Curves (red) fit to f0 data are single exponential (dashed), Eq. 9a, or expanded theory (solid) accounting for heterogeneity in liposome radius, Eq. 10.
Figure 9.
Figure 9.
Liposome size distribution. Liposomes were examined by cryoelectron microscopy to determine the population's size distribution. Liposomes near the edge of the hole in the carbon film are shown, along with a histogram of radii, pi, calculated from ∼400 measurements.
Figure 10.
Figure 10.
Unitary turnover rates for 445 variants. Unitary turnover rates, γ0, were measured for the Y445 substitutions indicated, by the initial-velocity method. Each bar represents mean ± SEM of three to six independent determinations. The 445 substitutions are arranged from left to right in order of the H+/Cl transport ratio, Y being the most coupled, and G the least.

References

    1. Accardi, A., and M. Pusch. 2003. Conformational changes in the pore of CLC-0. J. Gen. Physiol. 122:277–294. - PMC - PubMed
    1. Accardi, A., L. Kolmakova-Partensky, C. Williams, and C. Miller. 2004. Ionic currents mediated by a prokaryotic homologue of CLC Cl− channels. J. Gen. Physiol. 123:109–119. - PMC - PubMed
    1. Accardi, A., S. Lobet, C. Williams, C. Miller, and R. Dutzler. 2006. Synergism between halide binding and proton transport CLC-type exchanger. J. Mol. Biol. 362:691–699. - PubMed
    1. Accardi, A., and C. Miller. 2004. Secondary active transport mediated by a prokaryotic homologue of ClC Cl− channels. Nature. 427:803–807. - PubMed
    1. Accardi, A., M. Walden, W. Nguitragool, H. Jayaram, C. Williams, and C. Miller. 2005. Separate ion pathways in a Cl−/H+ exchanger. J. Gen. Physiol. 126:563–570. - PMC - PubMed

Publication types

MeSH terms

Associated data