Comparative Study
. 2007 Apr 10;104(15):6099-106.
doi: 10.1073/pnas.0701631104. Epub 2007 Mar 26.

Recurrent DNA inversion rearrangements in the human genome

Affiliations
Comparative Study

Recurrent DNA inversion rearrangements in the human genome

Margarita Flores et al. Proc Natl Acad Sci U S A. .

Abstract

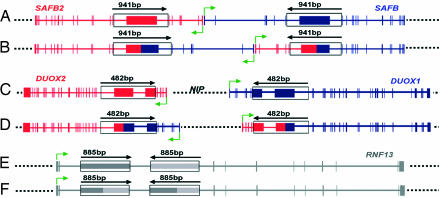
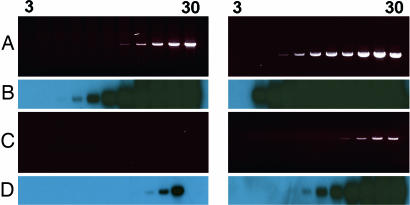
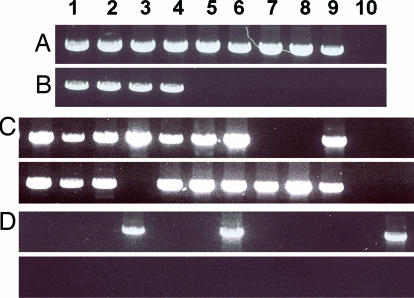
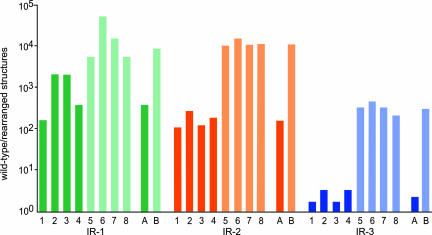
Several lines of evidence suggest that reiterated sequences in the human genome are targets for nonallelic homologous recombination (NAHR), which facilitates genomic rearrangements. We have used a PCR-based approach to identify breakpoint regions of rearranged structures in the human genome. In particular, we have identified intrachromosomal identical repeats that are located in reverse orientation, which may lead to chromosomal inversions. A bioinformatic workflow pathway to select appropriate regions for analysis was developed. Three such regions overlapping with known human genes, located on chromosomes 3, 15, and 19, were analyzed. The relative proportion of wild-type to rearranged structures was determined in DNA samples from blood obtained from different, unrelated individuals. The results obtained indicate that recurrent genomic rearrangements occur at relatively high frequency in somatic cells. Interestingly, the rearrangements studied were significantly more abundant in adults than in newborn individuals, suggesting that such DNA rearrangements might start to appear during embryogenesis or fetal life and continue to accumulate after birth. The relevance of our results in regard to human genomic variation is discussed.


Figures

Fig. 1.
Fig. 1.
Detection of wild-type and rearranged structures by PCR. (A) Repeated sequences in inverse orientation. (B) Structures formed by an inversion rearrangement. White or black large arrowheads represent the wild-type identical cores a and b, respectively (see Results); mixed (white and black) large arrowheads represent the repeated cores after the rearrangement. Thin black arrows represent PCR primers: Fa, forward primer of region a; Ra, reverse primer of region a; Fb, forward primer of region b, Rb, reverse primer of region b (see Results). Dashed arrows represent the DNA between the corresponding repeated sequences; solid lines represent DNA outside the segment containing the corresponding repeated sequences.
Fig. 2.
Fig. 2.
Bioinformatic workflow pathway to select appropriate regions to study human genome dynamics by PCR. Different steps of the workflow pathway as described in the text. Dark gray zones represent identical cores a and b of each region. Light gray zones represent homologous regions adjacent to identical cores. Black zones represent common repeats of the human genome. White zones represent DNA segments that can be used to design the corresponding PCR primers. Dashed arrows represent DNA present between the identical cores of the corresponding region. Black lines represent the position of primers: Fa, forward primer(s) of region a; Ra, reverse primer(s) of region a; Fb, forward primer(s) of region b; Rb, reverse primer(s) of region b. The restrictions imposed in different steps are indicated in the first step in which they were introduced (see Results). The numbers of PRIS remaining after the different restrictions imposed are indicated in parenthesis; from step F, of the 35 PRIS remaining only 10 were analyzed (see Results).
Fig. 3.
Fig. 3.
Localization of moderately sized PRIS in the human chromosomes. Starting on the left-hand side of the figure, human chromosomes 1–22, X, and Y are aligned by the centromere (indicated by dots at the left and right side of the figure). The p arm is shown at the top and the q arm at the bottom of each chromosome. The lines indicate the position of the 1,442 PRIS formed by two cores of intrachromosomal inverted DNA sequences sharing 100% identity with a size ranging from 400 to 4,000 nucleotides and situated at a distance between 4 kb and 100 kb (see Results). The set of workable PRIS (see Results) is indicated by red lines. The red triangles correspond to the three PRIS analyzed in this study and referred to in the text as regions IR-1 (in chromosome 19), IR-2 (in chromosome 15), and IR-3 (in chromosome 3).
Fig. 4.
Fig. 4.
Detection of wild-type and rearranged structures by PCR. Total human DNA isolated from blood cells of an adult individual (see Materials and Methods) was used as target for PCR primed with the oligonucleotides indicated in SI Table 2 for the RKits corresponding to regions IR-1 (Left), IR-2 (Center), and IR-3 (Right). (Upper) Shown are the PCR products stained with ethidium bromide. (Lower) Shown are the autoradiographies of Southern blots of the gels shown in the upper blots hybridized with the corresponding probe for each region. A, PCRs corresponding to the a core; B, PCRs corresponding to the b core; C, PCRs corresponding to the structure formed by the inversion rearrangement. The migration of the PCR products corresponds to their expected sizes in bp, which are as follows: 2,603; 2,845; 2,876; 2,070; 2,885; 2,694; 3,344; 2,894; and 2,806 from left to right.
Fig. 5.
Fig. 5.
Characteristics of the regions analyzed to detect inversion rearrangements in the human genome. (A) Wild-type structure of IR-1. (B) Inverted structure of IR-1. (C) Wild-type structure of IR-2. (D) Inverted structure of IR-2. (E) Wild-type structure of IR-3. (F) Inverted structure of IR-3. Horizontal solid lines correspond to genes harboring the cores participating in the rearrangement; vertical solid zones correspond to the exons of such genes. In IR-1 and IR-2 where two homologous genes, SAFB2/SAFB and DUOX2/DUOX1, respectively, participate in the rearrangement, one gene is shown in red and one is shown in blue. In IR-3, the gene where the rearrangement is localized is shown in gray. Green arrows indicate the site of initiation and the direction of transcription of each gene. Dotted lines represent DNA between or outside the genes involved in the rearrangements. The identical cores of each region are represented as rectangles. The size scale is different for each region and is expanded in the identical cores; the size of each core is indicated above a solid arrow that shows the relative orientation of each core. The rest of the scale is similar for the various structures present but is different for each region. The scales can be inferred from the size of the DNA segment between the identical cores in each region; 36,924; 24,128; and 7,935 bp for IR-1, IR-2, and IR-3, respectively. In IR-2, the presence of gene NIP in the region between genes DUOX2 and DUOX1 is indicated.
Fig. 6.
Fig. 6.
Time kinetics of the PCR to detect wild-type and inverted structures. A 100-ng DNA sample from blood cells of an adult individual was used as target for PCR. The reactions were primed with the oligonucleotides to detect the wild-type structure of core a (A and B) and of the inverted structure (C and D) of region IR-1 (as indicated in SI Table 2). (Left) PCR primary reaction. (Right) PCR secondary reaction. Aliquots were taken every 3 cycles, from cycle 3 to cycle 30. The PCR products were revealed with either ethidium bromide (A and C) or by Southern blots hybridized with the corresponding probe (B and D).
Fig. 7.
Fig. 7.
Dilution kinetics to detect wild-type and inverted structures. A DNA sample from blood cells of an adult individual was used as target for PCR. PCR was primed with the oligonucleotides to detect the wild-type structure of core a (A) and the inverted structure (B–D) of IR-1 (as indicated in SI Table 2). The PCR products were revealed by ethidium bromide after gel electrophoresis. (A and B) Different amounts of DNA were used: 1, 100 ng; 2, 33 ng; 3, 10 ng; 4, 3 ng; 5, 1 ng; 6, 333 pg; 7, 100 pg; 8, 33 pg; 9, 10 pg, 10, 3 pg. (C and D) Twenty-four different aliquots containing 3 ng (C) or 1 ng (D) of DNA were used to detect the inverted structure.
Fig. 8.
Fig. 8.
Relative concentration of wild-type and inverted structures in DNA samples isolated from different nonrelated individuals. DNA isolated from blood cells of different individuals was used as target for PCR. The reaction was primed with the oligonucleotides indicated in SI Table 2 to detect the a cores or the inverted structures of IR-1, IR-2, and IR-3. The amount of wild-type and inverted structures was determined by analyzing several aliquots from samples containing different amounts of DNA (see Results). The relative amount of wild-type structures to inverted structures is indicated in a logarithmic scale. 1–4, DNA samples from four different adult individuals; 5–8, DNA samples from umbilical cord blood of four different newborns (see Materials and Methods); A, mean value for DNA from adult individuals; B, mean value for DNA from newborn individuals.

References

    1. Alt F, Kellems RE, Bertino JR, Schimke RT. J Biol Chem. 1978;253:1357–1370. - PubMed
    1. Schimke RT. Cell. 1984;37:705–713. - PubMed
    1. Shaw CJ, Lupski JR. Hum Mol Genet. 2004;13:R57–R64. - PubMed
    1. Higgs DR, Old JM, Pressley L, Clegg JB, Weatherall DJ. Nature. 1980;284:632–635. - PubMed
    1. Stankiewicz P, Lupski JR. Curr Opin Genet. 2002;12:312–319. - PubMed

Publication types

LinkOut - more resources