. 2007 Apr 3;104(14):5883-8.
doi: 10.1073/pnas.0609996104. Epub 2007 Mar 26.

Molecular and electrophysiological characterization of a mechanosensitive channel expressed in the chloroplasts of Chlamydomonas

Affiliations

Molecular and electrophysiological characterization of a mechanosensitive channel expressed in the chloroplasts of Chlamydomonas

Yoshitaka Nakayama et al. Proc Natl Acad Sci U S A. .

Abstract

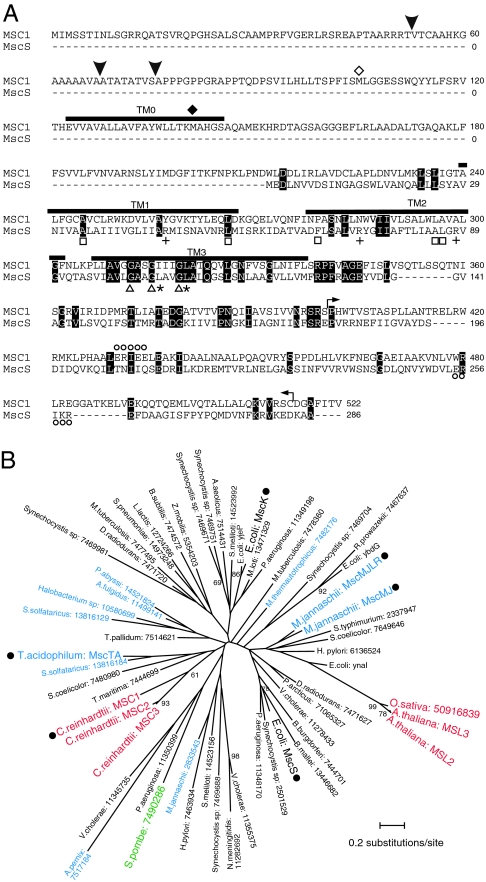
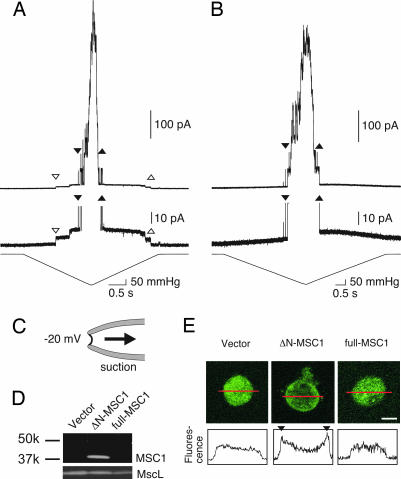
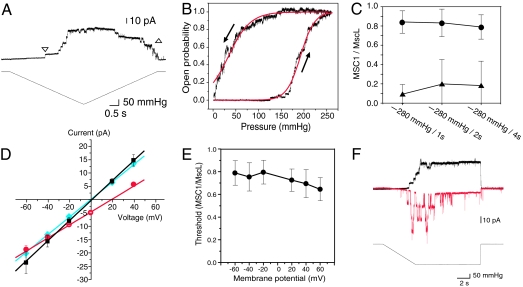
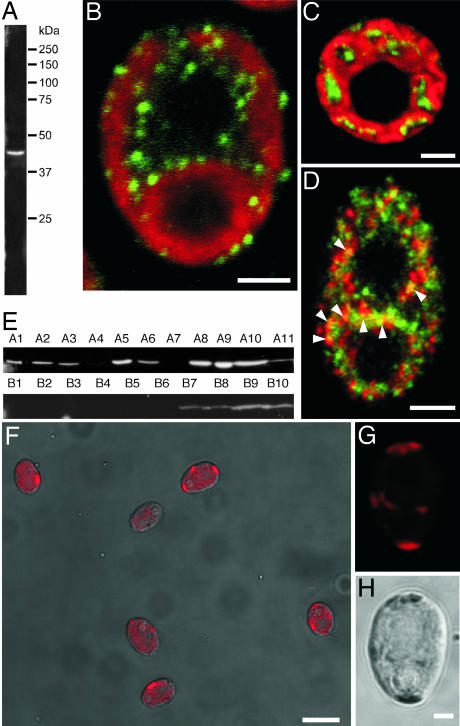
MscS is a mechanosensitive channel that is ubiquitous among bacteria. Recent progress in the genome projects has revealed that homologs of MscS are also present in eukaryotes, but whether they operate as ion channels is unknown. In this study we cloned MSC1, a homolog of MscS in Chlamydomonas, and examined its function when expressed in Escherichia coli. Full-length MSC1 was not functional when expressed in E. coli cells. However, removal of the N-terminal signal sequence (DeltaN-MSC1) reversed this effect. DeltaN-MSC1 was found to open in response to membrane stretch and displayed a preference for anions over cations as permeable ions. DeltaN-MSC1 exhibited marked hysteretic behavior in response to ascending and descending stimuli. That is, channel gating occurred in response to significant stimuli but remained open until the stimulus was almost completely removed. Indirect immunofluorescence revealed that MSC1 is present as punctate spots in the cytoplasm and chloroplasts. Moreover, knockdown of MSC1 expression resulted in the abnormal localization of chlorophyll. These findings show that MSC1 is an intracellular mechanosensitive channel and is responsible for the organization of chloroplast in Chlamydomonas.


Conflict of interest statement

The authors declare no conflict of interest.

Figures

Fig. 1.
Fig. 1.
MSC1 sequence and phylogenic relationships. (A) MSC1 aligned with E. coli MscS. Identical residues are highlighted. Thick lines indicate the predicted transmembrane domains. Symbols represent the glycine residues important for TM3 packing (triangles), the leucine residues that form a pore constriction (asterisks), the hydrophobic residues involved in tension sensing (squares), the residues serving as a pH sensor (circles), the residues that are a possible voltage sensor (crosses), and predicted cleavage sites (arrowheads). The start codons (methionine) for ΔN-MSC1 and ΔTM0-MSC1 are indicated by open and filled diamonds, respectively. The sequence bounded by the two arrows was used as antigen. (B) The maximum likelihood (ML) tree of the MscS family proteins inferred by the JTT (Jones, Taylor, and Thornton) model. Colors represent bacteria (black), archaea (blue), fungi (green), and eukarya (red). Bootstrap proportions (BPs) by the 100 repetitions of the ML method are attached to internal branches. Unmarked branches have <60 bootstrap proportions. Filled circles indicate that these products have been identified as mechanosensitive channels by electrophysiological means (2, 4, 35, 36). The accession numbers are provided after the names of the species.
Fig. 2.
Fig. 2.
Channel activity and expression of MSC1 in mscs- and msck-null E. coli. (A and B) Current recordings from an inside-out patch excised from giant spheroplasts expressing ΔN-MSC1 (A) or harboring an empty vector (B). The second trace is an expanded view of the upper trace. The pressure applied to the patch is presented with the expanded trace. The downward and upward triangles indicate the beginning and the end of ΔN-MSC1 (open triangles) and E. coli MscL (filled triangles) activity, respectively. The membrane potential was held at −20 mV where not indicated. Voltage represents the potential of the intracellular (bath) side to that of the periplasmic (pipette) side. (C) Configuration of the patch-clamp experiment. (D) Western blot analysis of membrane fraction prepared from cells harboring empty vector or expressing ΔN-MSC1 or full-length MSC1. Anti-MSC1 (Upper) and anti-MscL (Lower) were used as the primary antibodies. (E) Immunostaining of a giant spheroplast for MSC1 (Upper). Fluorescence intensity profiles (arbitrary units) of the confocal sections along the red line are shown in Lower. Fluorescence peaks were observed at the cell membrane (triangles) in cells expressing ΔN-MSC1. (Scale bar: 2 μm.)
Fig. 3.
Fig. 3.
The conductance of ΔN-MSC1 recorded from the inside-out patches from the giant spheroplasts of mscl- and mscs-null E. coli (A, B, D, and F) and mscs- and msck-null E. coli (C and E). (A) Channel activity in response to increasing and decreasing pressure. The beginning and the end of the channel activity are shown by downward and upward triangles, respectively. (B) Change in the open probability in response to increasing and decreasing pressure. Current traces from a single patch were summed and normalized. Dose–response curves were fitted with a two-state Boltzmann-type model (3). (C) Opening and closing threshold of ΔN-MSC1 to increasing (circles) and decreasing (triangles) pressure, respectively. The ratio of ΔN-MSC1 gating threshold relative to MscL threshold is plotted. (D) Current–voltage curve of ΔN-MSC1 in bath and pipette solutions containing 200 mM KCl, 40 mM MgCl2, 10 mM CaCl2, 0.1 mM EDTA, and 5 mM Hepes·KOH (black). Alternatively, the KCl concentration of the bath solution was reduced to 20 mM (red), or the CaCl2 concentration of the bath solution was reduced to 1 mM (blue). The data are fitted with linear regression lines. (E) Threshold for ΔN-MSC1 opening at various voltages. The threshold for ΔN-MSC1 is normalized to that of E. coli MscL (n = 10). (F) Inactivation of MSC1. Shown are current traces at −20 mV (black) and +60 mV (red). Bars represent standard deviations.
Fig. 4.
Fig. 4.
Localization of MSC1 in Chlamydomonas cells. (A) Western blot analysis of total cell lysate for MSC1. (B and C) Representative images of indirect immunofluorescence labeling of MSC1 (green) and chloroplast autofluorescence (red) in longitudinal (B) and transverse (C) confocal microscopic sections of wild-type cells. (D) Immunofluorescent labeling of MSC1 (green) and KDEL (red). MSC1 partially colocalizes with KDEL (arrowheads, yellow). (E) Western blot analysis of total cell lysate from MSC1 RNAi transformants for MSC1. MSC1 gene expression was successfully suppressed in eight transformants. Strains A4, A7, B1, and B2 were chosen for further analysis. (F) Overlap of a chlorophyll autofluorescence image (red) and a phase contrast image from the B2 strain. (G and H) Chloroplast autofluorescence (G) and phase contrast (H) images obtained from the same B2 strain cell, in which MSC1 was knocked down. Chlorophyll fluorescence was restricted to a small region in MSC1 knockdown cell. (Scale bars: B–D and H, 2 μm; F, 10 μm.)

Similar articles

Cited by

References

    1. Guharay F, Sachs F. J Physiol. 1985;363:119–134. - PMC - PubMed
    1. Levina N, Tötemeyer S, Stokes NR, Louis P, Jones MA, Booth IR. EMBO J. 1999;18:1730–1737. - PMC - PubMed
    1. Martinac B, Buechner M, Delcour AH, Adler J, Kung C. Proc Natl Acad Sci USA. 1987;84:2297–2301. - PMC - PubMed
    1. Li Y, Moe PC, Chandrasekaran S, Booth IR, Blount P. EMBO J. 2002;21:5323–5330. - PMC - PubMed
    1. Pivetti CD, Yen MR, Miller S, Busch W, Tseng YH, Booth IR, Saier MH., Jr Microbiol Mol Biol Rev. 2003;67:66–85. - PMC - PubMed

Publication types

MeSH terms

Associated data

LinkOut - more resources