

Homer 1a uncouples metabotropic glutamate receptor 5 from postsynaptic effectors
- PMID: 17389377
- PMCID: PMC1851615
- DOI: 10.1073/pnas.0608991104
Homer 1a uncouples metabotropic glutamate receptor 5 from postsynaptic effectors
Abstract
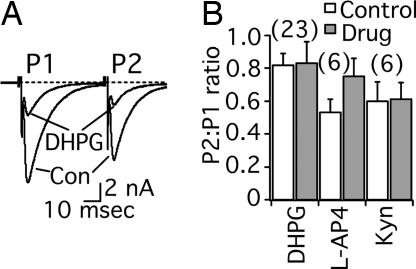
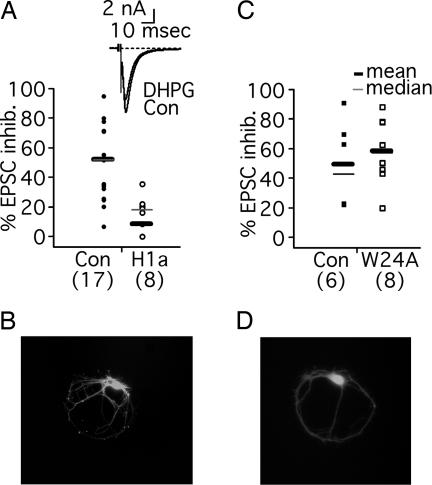
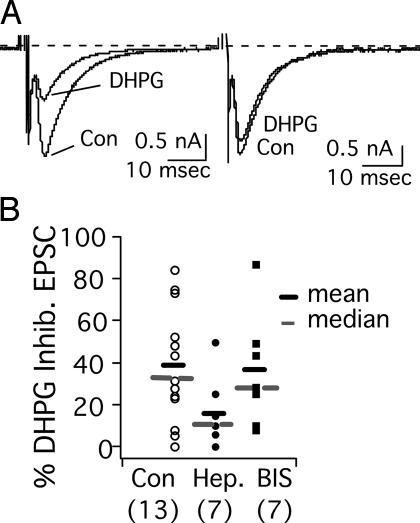
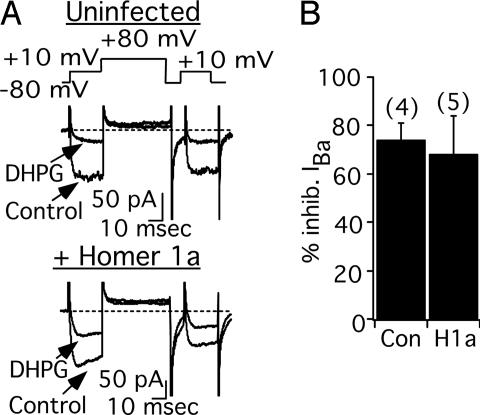
Metabotropic glutamate receptors (mGluRs) and Homer proteins play critical roles in neuronal functions including plasticity, nociception, epilepsy, and drug addiction. Furthermore, Homer proteins regulate mGluR1/5 function by acting as adapters and facilitating coupling to effectors such as the inositol triphosphate receptor. However, although Homer proteins and their interaction with mGluRs have been the subject of intense study, direct measurements of Homer-induced changes in postsynaptic mGluR-effector coupling have not been reported. This question was addressed here by examining glutamatergic excitatory postsynaptic currents (EPSCs) in rat autaptic hippocampal cultures. In most neurons, the group I mGluR agonist (S)-3,5-dihydroxyphenylglycine strongly inhibited the EPSC acutely. This modulation occurred postsynaptically, was mediated primarily by mGluR5, and was inositol triphosphate receptor-dependent. Expression of the dominant negative, immediate early form of Homer, Homer 1a, strongly reduced EPSC modulation, but the W24A mutant of Homer 1a, which cannot bind mGluRs, had no effect. (S)-3,5-dihydroxyphenylglycine-mediated intracellular calcium responses in the processes of Homer 1a-expressing neurons were reduced compared with those in Homer 1a W24A-expressing cells. However, neither the distribution of mGluR5 nor the modulation of somatic calcium channels was altered by Homer 1a expression. These data demonstrate that Homer 1a can reduce mGluR5 coupling to postsynaptic effectors without relying on large changes in the subcellular distribution of the receptor. Thus, alteration of mGluR signaling by changes in Homer protein expression may represent a viable mechanism for fine-tuning synaptic strength in neurons.
Conflict of interest statement
The authors declare no conflict of interest.
Figures


Similar articles
-
Endogenous homer proteins regulate metabotropic glutamate receptor signaling in neurons.J Neurosci. 2008 Aug 20;28(34):8560-7. doi: 10.1523/JNEUROSCI.1830-08.2008. J Neurosci. 2008. PMID: 18716215 Free PMC article.
-
Homer proteins regulate coupling of group I metabotropic glutamate receptors to N-type calcium and M-type potassium channels.J Neurosci. 2000 Oct 1;20(19):7238-45. doi: 10.1523/JNEUROSCI.20-19-07238.2000. J Neurosci. 2000. PMID: 11007880 Free PMC article.
-
Surface clustering of metabotropic glutamate receptor 1 induced by long Homer proteins.BMC Neurosci. 2006 Jan 4;7:1. doi: 10.1186/1471-2202-7-1. BMC Neurosci. 2006. PMID: 16393337 Free PMC article.
-
Homer/Vesl proteins and their roles in CNS neurons.Mol Neurobiol. 2004 Jun;29(3):213-27. doi: 10.1385/MN:29:3:213. Mol Neurobiol. 2004. PMID: 15181235 Review.
-
Homer 1a and mGluR5 phosphorylation in reward-sensitive metaplasticity: A hypothesis of neuronal selection and bidirectional synaptic plasticity.Brain Res. 2015 Dec 2;1628(Pt A):17-28. doi: 10.1016/j.brainres.2015.06.037. Epub 2015 Jul 14. Brain Res. 2015. PMID: 26187757 Review.
Cited by
-
Metabotropic glutamate receptor subtype 5: molecular pharmacology, allosteric modulation and stimulus bias.Br J Pharmacol. 2016 Oct;173(20):3001-17. doi: 10.1111/bph.13281. Epub 2015 Nov 11. Br J Pharmacol. 2016. PMID: 26276909 Free PMC article. Review.
-
HOMER2, a stereociliary scaffolding protein, is essential for normal hearing in humans and mice.PLoS Genet. 2015 Mar 27;11(3):e1005137. doi: 10.1371/journal.pgen.1005137. eCollection 2015 Mar. PLoS Genet. 2015. PMID: 25816005 Free PMC article.
-
Metabotropic glutamate receptor function and regulation of sleep-wake cycles.Int Rev Neurobiol. 2023;168:93-175. doi: 10.1016/bs.irn.2022.11.002. Epub 2023 Jan 13. Int Rev Neurobiol. 2023. PMID: 36868636 Free PMC article.
-
Withdrawal From Cocaine Self-administration Alters the Regulation of Protein Translation in the Nucleus Accumbens.Biol Psychiatry. 2018 Aug 1;84(3):223-232. doi: 10.1016/j.biopsych.2018.02.012. Epub 2018 Feb 23. Biol Psychiatry. 2018. PMID: 29622268 Free PMC article.
-
Homer1/mGluR5 activity moderates vulnerability to chronic social stress.Neuropsychopharmacology. 2015 Mar 13;40(5):1222-33. doi: 10.1038/npp.2014.308. Neuropsychopharmacology. 2015. PMID: 25409593 Free PMC article.
References
-
- Anwyl R. Brain Res Brain Res Rev. 1999;29:83–120. - PubMed
-
- Schoepp DD. J Pharmacol Exp Ther. 2001;299:12–20. - PubMed
-
- Bortolotto ZA, Fitzjohn SM, Collingridge GL. Curr Opin Neurobiol. 1999;9:299–304. - PubMed
-
- Brakeman PR, Lanahan AA, O'Brien R, Roche K, Barnes CA, Huganir RL, Worley PF. Nature. 1997;386:284–288. - PubMed
Publication types
MeSH terms
Substances
LinkOut - more resources
Full Text Sources
