

Hepatic overexpression of glycerol-sn-3-phosphate acyltransferase 1 in rats causes insulin resistance
- PMID: 17389595
- PMCID: PMC2819346
- DOI: 10.1074/jbc.M611550200
Hepatic overexpression of glycerol-sn-3-phosphate acyltransferase 1 in rats causes insulin resistance
Abstract
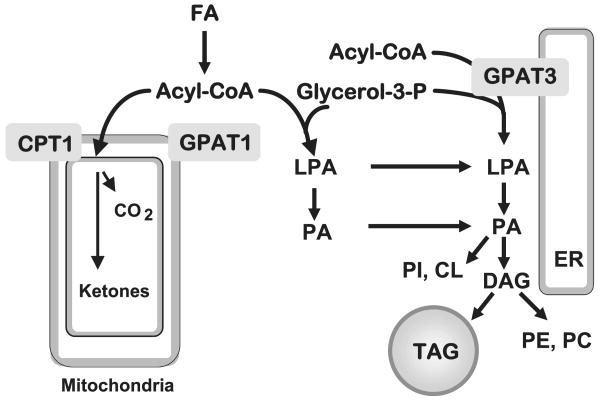
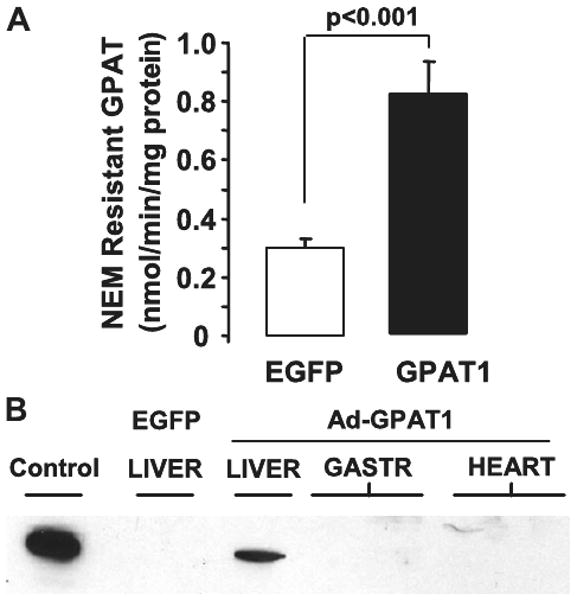
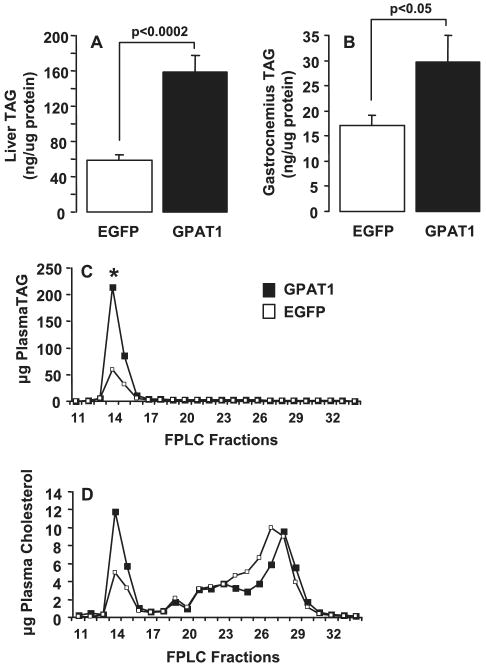
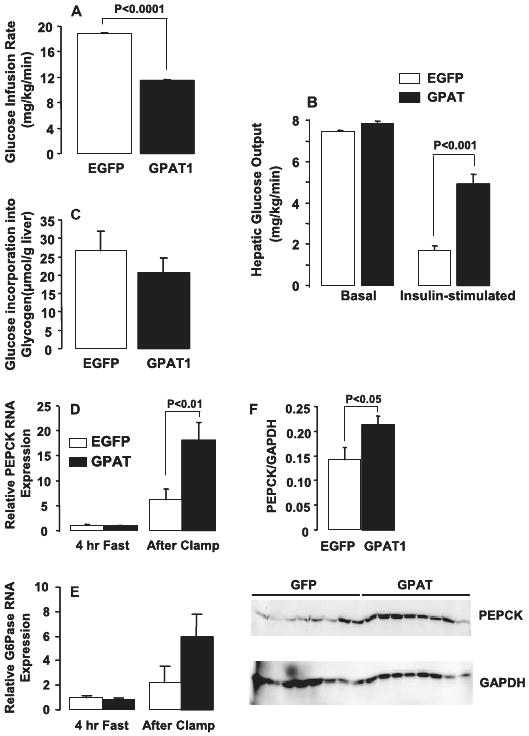
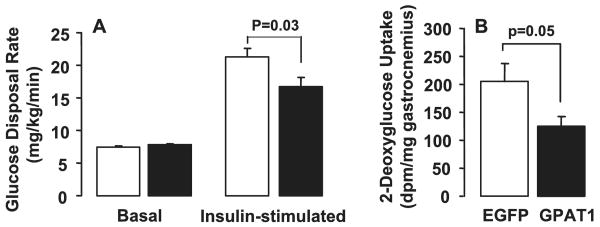
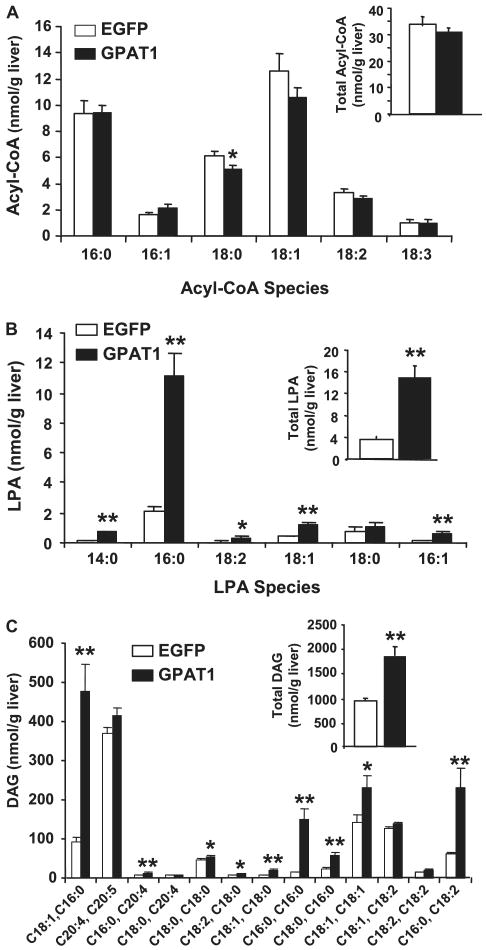
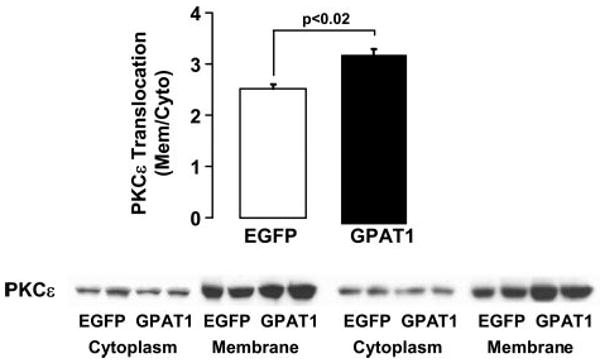
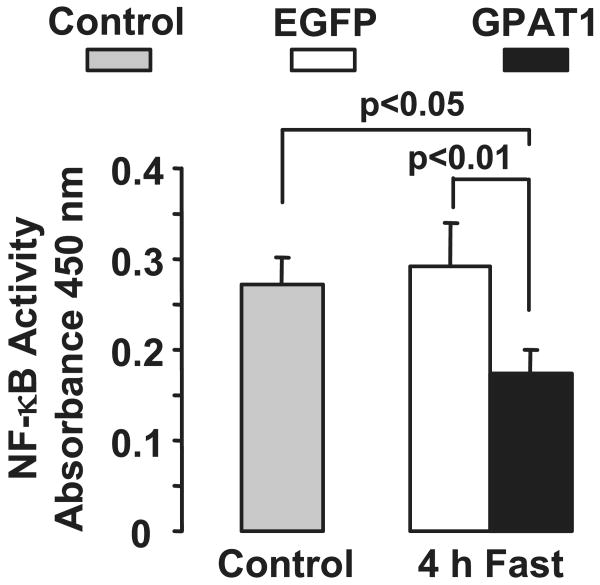
Fatty liver is commonly associated with insulin resistance and type 2 diabetes, but it is unclear whether triacylglycerol accumulation or an excess flux of lipid intermediates in the pathway of triacyglycerol synthesis are sufficient to cause insulin resistance in the absence of genetic or diet-induced obesity. To determine whether increased glycerolipid flux can, by itself, cause hepatic insulin resistance, we used an adenoviral construct to overexpress glycerol-sn-3-phosphate acyltransferase-1 (Ad-GPAT1), the committed step in de novo triacylglycerol synthesis. After 5-7 days, food intake, body weight, and fat pad weight did not differ between Ad-GPAT1 and Ad-enhanced green fluorescent protein control rats, but the chow-fed Ad-GPAT1 rats developed fatty liver, hyperlipidemia, and insulin resistance. Liver was the predominant site of insulin resistance; Ad-GPAT1 rats had 2.5-fold higher hepatic glucose output than controls during a hyperinsulinemic-euglycemic clamp. Hepatic diacylglycerol and lysophosphatidate were elevated in Ad-GPAT1 rats, suggesting a role for these lipid metabolites in the development of hepatic insulin resistance, and hepatic protein kinase Cepsilon was activated, providing a potential mechanism for insulin resistance. Ad-GPAT1-treated rats had 50% lower hepatic NF-kappaB activity and no difference in expression of tumor necrosis factor-alpha and interleukin-beta, consistent with hepatic insulin resistance in the absence of increased hepatic inflammation. Glycogen synthesis and uptake of 2-deoxyglucose were reduced in skeletal muscle, suggesting mild peripheral insulin resistance associated with a higher content of skeletal muscle triacylglycerol. These results indicate that increased flux through the pathway of hepatic de novo triacylglycerol synthesis can cause hepatic and systemic insulin resistance in the absence of obesity or a lipogenic diet.
Figures
References
-
- Marchesini G, Bugianesi E, Forlani G, Lenzi M, Manini R, Naale S, Banni E, Villanova N, Melchionda N, Rizzetto M. Hepatology. 2002;37:917–923. - PubMed
-
- Reusch J. Am J Cardiol. 2002;90(suppl):19G–26G. - PubMed
-
- Chitturi S, Abeygunasekera S, Farrell GC, Holmes-Walker J, Hui JM, Fung C, Karim R, Lin R, Smarasinghe D, Liddle C, Weltman M, George J. Hepatology. 2001;35:373–379. - PubMed
-
- Younossi ZM, Diehl AM, Ong JP. Hepatology. 2002;35:746–752. - PubMed
-
- Den Boer M, Voshol PJ, Kuipers F, Havekes LM, Romijin JA. Arterioscler Thromb Vasc Biol. 2004;24:644–649. - PubMed
Publication types
MeSH terms
Substances
Grants and funding
- DK-40936/DK/NIDDK NIH HHS/United States
- R01 DK060667/DK/NIDDK NIH HHS/United States
- P01 DK058398/DK/NIDDK NIH HHS/United States
- U24 DK059635/DK/NIDDK NIH HHS/United States
- R01 DK040936/DK/NIDDK NIH HHS/United States
- R56 DK060667/DK/NIDDK NIH HHS/United States
- DK60667/DK/NIDDK NIH HHS/United States
- P30 DK056350/DK/NIDDK NIH HHS/United States
- DK-58398/DK/NIDDK NIH HHS/United States
- U24 DK59635/DK/NIDDK NIH HHS/United States
- P30 DK034987/DK/NIDDK NIH HHS/United States
- R56 DK056598/DK/NIDDK NIH HHS/United States
- R01 DK056598/DK/NIDDK NIH HHS/United States
- DK56598/DK/NIDDK NIH HHS/United States
- P30 DK34987/DK/NIDDK NIH HHS/United States
LinkOut - more resources
Full Text Sources
