. 2007:3:86.
doi: 10.1038/msb4100127. Epub 2007 Mar 27.

Backup without redundancy: genetic interactions reveal the cost of duplicate gene loss

Affiliations

Backup without redundancy: genetic interactions reveal the cost of duplicate gene loss

Jan Ihmels et al. Mol Syst Biol. 2007.

Abstract

Many genes can be deleted with little phenotypic consequences. By what mechanism and to what extent the presence of duplicate genes in the genome contributes to this robustness against deletions has been the subject of considerable interest. Here, we exploit the availability of high-density genetic interaction maps to provide direct support for the role of backup compensation, where functionally overlapping duplicates cover for the loss of their paralog. However, we find that the overall contribution of duplicates to robustness against null mutations is low ( approximately 25%). The ability to directly identify buffering paralogs allowed us to further study their properties, and how they differ from non-buffering duplicates. Using environmental sensitivity profiles as well as quantitative genetic interaction spectra as high-resolution phenotypes, we establish that even duplicate pairs with compensation capacity exhibit rich and typically non-overlapping deletion phenotypes, and are thus unable to comprehensively cover against loss of their paralog. Our findings reconcile the fact that duplicates can compensate for each other's loss under a limited number of conditions with the evolutionary instability of genes whose loss is not associated with a phenotypic penalty.


Figures

Figure 1
Figure 1
(A) Enrichment of duplicates with SSL interactions. Shown is the fraction of duplicates (blue) and random gene pairs with interaction strength less than the threshold value s, as a function of s. The threshold used in this work to define SSL interactions is sthr=−3. (B) The subset of duplicates and singletons for which interaction data are available exhibits an excess of duplicate fitness similar to that reported earlier for a genome-wide set by Gu et al (2003). Shown is the number of genes assigned to the two fitness classes (Materials and methods), for duplicates and singletons. (C) The excess number of duplicate genes in the WNP class compared to singletons corresponds to the number of SSL duplicates in the data set. Shown is the total number of duplicates covered by the genetic interaction data set (left column) and the number assigned to the WNP class (middle column). The number of SSL duplicates is indicated in light blue. The right column shows how many WNP singletons are expected for the same number of genes, based on the proportion of singletons assigned to that class. (D) The observed correspondence between excess fitness and the number of backup duplicates remains stable over a range of fitness thresholds defining the WNP class (Materials and methods). Shown is the number of SSL duplicates assigned to the WNP class (orange) and the difference between the observed number of WNP duplicates and the expected number of WNP singletons (blue), as a function of the fitness threshold.
Figure 2
Figure 2
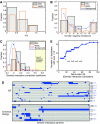
(A) Backup (WNP) SSL duplicates have more similar sequences than non-SSL duplicates. Shown is the distribution of non-synonymous substitution rates ka for both sets of genes. A corresponding plot for the same measure normalized by the rate of silent substitutions is shown in Supplementary Figure 3. (B) Backup SSL duplicates have no less negative interactions than non-SSL duplicates and generic pairs of genes. No significant difference in the distributions of the number of interactions was found between the three groups (Kolmogorov–Smirnov test, P>0.4 and P>0.1). The number of interactions was normalized between the two data sets (Materials and methods). (C) Genetic correlation coefficients were evaluated as described in Materials and methods and by Schuldiner et al (2005). Shown are histograms of the distributions associated with SSL backup genes, non-SSL duplicates and random pairs of genes. The distributions between SSL and non-SSL duplicates are significantly different (Kolmogorov–Smirnov test P<0.002). (D) Genetic interactions of SSL duplicate pairs. Blue boxes in each lane indicate genes with an SSL interaction. Numbers next to the gene pairs represent the Pearson correlation coefficient of their genetic interaction profiles. The two matrices correspond to the two interaction data sets used. See Supplementary Table 2 for a list of specific and common interaction partners for each duplicate pair. An example of duplicates that are highly correlated in their genetic patterns but perform different functions is provided by alg6 and alg8, which are performing different functions within the same pathway. It is interesting to note that the interaction strength between these is significantly lower than for the remaining SSL duplicates (below the threshold of −3 used in this study), and that at least one of the genes (alg6) has a detectable deletion growth defect. (E) Duplicates are less correlated in their patterns of genetic interactions with their paralog than with other genes in the data set. For each duplicate, correlation coefficients between its epistatic profile and of each of the remaining genes in the data set were calculated and the resulting coefficients were rank-ordered. The rank R represents the rank of the correlation with the corresponding paralog in this sequence, for example, R=3 if the correlation with the duplicate copy was the third highest. Shown is the number of buffering duplicates for which the rank is at most R, as a function of R.
Figure 3
Figure 3
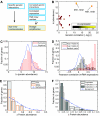
(A) Two distinct reasons for duplicate retention: functional divergence and dosage amplification for high copy numbers. (B) Relationship between similarity in genetic interaction patterns, protein abundance and mRNA coexpression. Shown is a scatter plot of genetic profile correlation (expressed as P-value to correct for different-size data sets) and protein copy numbers for backup SSL duplicates. Points are color-coded according to their expression correlation coefficients, as indicated. (C) Distribution of genome-wide protein copy numbers of the full set of duplicates and singletons (>2000 genes). (D) Expression profiles of abundant duplicates are significantly correlated (Kolmogorov–Smirnov test P=10−126). Duplicates were partitioned by their protein copy numbers, using a cutoff ln(abundance−cut)=9 (dashed line in (C)). Shown is the distribution of Pearson correlation coefficients between expression profiles of random sets of genes (blue line), abundant duplicates (red bars) and duplicates where at least one paralog is less abundant than the cutoff (gray bars). As in (C), the full set of duplicates and singletons was used. The effect remained qualitatively similar and highly significant (P=10−95) after ribosomal proteins were removed from the analysis (Supplementary Figure 4). Distributions for abundant and non-abundant random pairs of genes are shown in Supplementary Figure 5. (E) Abundance values of duplicates and in particular backup SSL are significantly more similar than those of unrelated pairs of genes (P=10−4). The similarity in protein abundances of a pair of genes is represented by the quantity Δabundance=(ab(a)−ab(b))/(ab(a)+ab(b)), where a and b represent the protein copy numbers of each paralog. Shown are the distributions for random pairs of genes (blue line), backup SSL (gray bars) and NSSL genes (orange bars). (F) On a genomic scale, the tendency of duplicates toward similar copy numbers is significant (P=10−13) and greatest for duplicates with correlated expression profiles. Shown are the distributions of abundance similarity for generic duplicates (light gray), duplicates whose expression correlation is at least 0.6 (white bars), duplicates whose expression correlation is at least 0.8 (dark gray bars) and random pairs of genes (blue lines). The full set of duplicates and singletons was used. Removal or ribosomal genes from the analysis resulted in similar distributions (Supplementary Figure 6), albeit with lower P-value (<10−7).
Figure 4
Figure 4
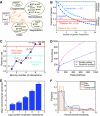
(A) Genetic interactions can elicit phenotypes from genes required only in specific conditions. The two genes hac1 and ire1 are inducers of the unfolded protein response, whose deletion has little or no effect on cellular growth rate (deletion fitness f=1 in both cases). However, simultaneous deletion of genes affecting protein folding results in a strong growth defect (synthetic interaction). (B) Genetic interactions reveal a phenotype for many genes that are missed in single gene deletion assays under the same conditions (rich media). Shown in blue is the fraction of genes with at least × SSL interactions, as a function of x. Two different significance cutoffs for negative interactions were used (light and dark blue). The red and orange lines represent the fraction of genes with a deletion growth defect, for two choices of the fitness threshold (red and orange). (C) Genetic interactivity (number of negative interactions) correlates with probability of gene retention between S. cerevisiae and C. albicans. Comparisons with other yeast species produce similar results (Supplementary Figure 7). Genes covered by the ER interaction data set were arranged by the number of negative interactions and partitioned into bins of 50 genes each. The two lines correspond to genes of the same data set that are annotated as either essential or viable in the SGD database. For each bin, the fraction of genes shared between the species is shown. The range of the number of interactions is indicated above next to the data points. Results obtained using the chromosome biology data are similar (data not shown). The correlation between phylogenetic retention and genetic interactivity is stronger than that between retention and quantitative growth defects in rich media or across a range of environments (Supplementary Figure 8; correlations between binned quantities are r2=0.93, r2=0.56 and r2=0.89, respectively). (D) Comparison between the ability of sensitivity and genetic interaction profiles to cluster functionally similar genes. Gene associations based on profile similarity were evaluated against GO functional annotations (Materials and methods). The number of correct predictions was plotted against the number of false positives for a range of thresholds. Genes were limited to those assigned to the chromosome biology data set for both methods. (E) The number of genetic interactions is related to sensitivity of deletion mutants in response to 51 different drugs and environments. Genes were assigned to bins according to the logarithm of their number of genetic interactions. Each gene is associated with a score representing its combined sensitivity to the different environments (Materials and methods). Shown is the mean sensitivity score of genes assigned to each bin. The number of genes is indicated above the corresponding bars. The Pearson correlation coefficient between the unbinned quantities is c=0.36 (P<10−26). A similar result is obtained when only naturally occurring environments are considered (Supplementary Figure 9), with a correlation coefficient of c=0.32 (P<10−21). (F) Deletions of SSL duplicates have a comparable effect on growth rate across a range of environments as deletions of non-SSL duplicates and random genes. A similar result is obtained when only naturally occurring environments are considered (Supplementary Figure 6).

Comment in

Similar articles

Cited by

References

    1. Brookfield J (1992) Can genes be truly redundant? Curr Biol 2: 553–554 - PubMed
    1. Brown JA, Sherlock G, Myers CL, Burrows NM, Deng C, Wu HI, McCann KE, Troyanskaya OG, Brown JM (2006) Global analysis of gene function in yeast by quantitative phenotypic profiling. Mol Syst Biol 2: 2006.0001 16738548 - PMC - PubMed
    1. Cai JJ, Smith DK, Xia X, Yuen KY (2005) MBEToolbox: a MATLAB toolbox for sequence data analysis in molecular biology and evolution. BMC Bioinform 6: 64 - PMC - PubMed
    1. Collins SR, Schuldiner M, Krogan NJ, Weissman JS (2006) A strategy for extracting and analyzing large-scale quantitative epistatic interaction data. Genome Biol 7: R63. - PMC - PubMed
    1. Collins SR, Miller KM, Maas NL, Roguev A, Fillingham J, Chu CS, Schuldiner M, Gebbia M, Recht J, Shales M, Ding H, Xu H, Han J, Ingvarsdottir K, Cheng B, Andrews B, Berger SL, Hieter P, Zhang Z, Brown GW, Ingles J, Boone C, Emili A, Allis CD, Toczyski DP, Weissman JS, Greenblatt JF, Krogan NJ (2007) Functional dissection of yeast chromosome biology complexes using a genetic interaction map. Nature (in press) - PubMed

Publication types