. 2007 Mar 28;2(3):e323.
doi: 10.1371/journal.pone.0000323.

Gene expression patterns in pancreatic tumors, cells and tissues

Affiliations

Gene expression patterns in pancreatic tumors, cells and tissues

Anson W Lowe et al. PLoS One. .

Abstract

Background: Cancers of the pancreas originate from both the endocrine and exocrine elements of the organ, and represent a major cause of cancer-related death. This study provides a comprehensive assessment of gene expression for pancreatic tumors, the normal pancreas, and nonneoplastic pancreatic disease.

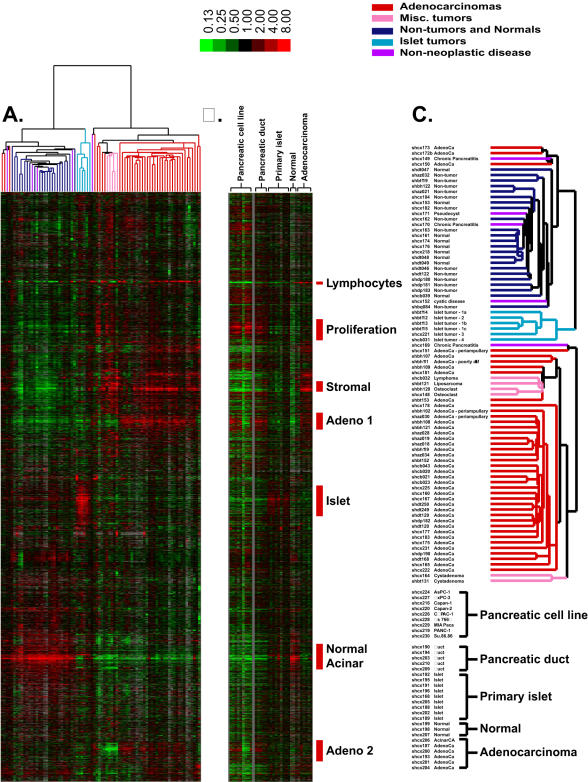
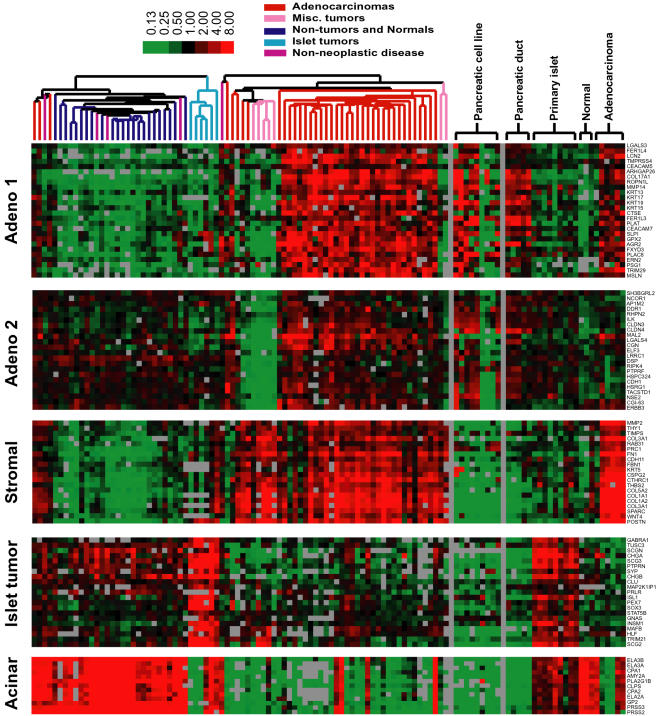
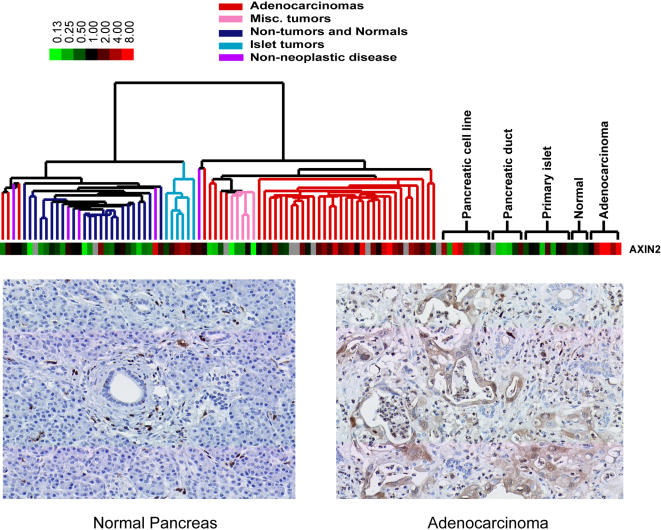
Methods/results: DNA microarrays were used to assess the gene expression for surgically derived pancreatic adenocarcinomas, islet cell tumors, and mesenchymal tumors. The addition of normal pancreata, isolated islets, isolated pancreatic ducts, and pancreatic adenocarcinoma cell lines enhanced subsequent analysis by increasing the diversity in gene expression profiles obtained. Exocrine, endocrine, and mesenchymal tumors displayed unique gene expression profiles. Similarities in gene expression support the pancreatic duct as the origin of adenocarcinomas. In addition, genes highly expressed in other cancers and associated with specific signal transduction pathways were also found in pancreatic tumors.

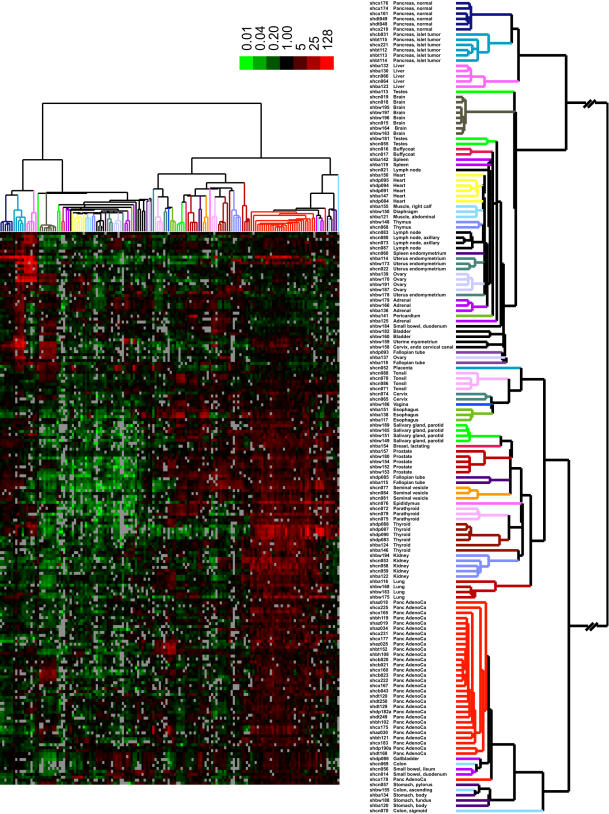
Conclusion: The scope of the present work was enhanced by the inclusion of publicly available datasets that encompass a wide spectrum of human tissues and enabled the identification of candidate genes that may serve diagnostic and therapeutic goals.


Conflict of interest statement

Competing Interests: The authors have declared that no competing interests exist.

Figures

Figure 1
Figure 1
Unsupervised hierarchical clustering of the patterns of variation in expression for 9,259 genes (represented by 16,959 cDNA) in 80 pancreatic tissue specimens (A). The image uses a color code to represent relative expression levels. Red represents expression levels greater than the mean for a given gene across all samples. Green represents expression levels less than the mean across samples. A color bar (top) relates color code to the magnitude of the differences in gene expression relative to the all-sample means for each gene. Grey indicates missing or excluded data. (B) Image representing gene expression in pancreatic cell lines, primary pancreatic duct and islet cells, normal pancreas, and adenocarcinomas. The cell lines and amplified samples were each mean-centered separately. The genes presented are organized and displayed in an identical manner to the genes shown in panel (A). (C) Enlarged view of the array dendrogram shown in panel A along with sample identification.
Figure 2
Figure 2
Expanded view of gene clusters shown in Figure 1A .Color code and experimental conditions are as described for Figure 1.
Figure 3
Figure 3
Immunohistochemistry of paraffin embedded pancreatic adenocarcinomas. Anti-galectin 4 (LGALS4) antibody (panel a). In situ hybridization for collagen 17A1 (COL17A1) (panel b) and mucin 13 (MUC13) (panel c). In situ hybridization sense control for MUC13 (panel d).
Figure 4
Figure 4
Cluster analysis of secretory and membrane proteins. Unsupervised hierarchical cluster analysis of expression of 187 genes encoding putative membrane or secreted proteins in normal pancreas, pancreatic adenocarcinoma, islet cell tumor tissues and a panel of normal tissues . Only genes for which 80% of spots met quality criteria were used. The figure shows 187 genes representing secretory or membrane-bound proteins that show enhanced expression in pancreatic adenocarcinomas or islet cell tumors. An enlarged view of the array dendrogram along with sample identification is shown on the right. A color bar (top) relates color code to the magnitude of the differences in gene expression relative to the all-sample means for each gene. Grey indicates missing or excluded data.
Figure 5
Figure 5
Axin 2 expression in islet cell tumors and adenocarcinomas. Pseudocolored image of axin 2 expression (top). Image represents mean centered values of sample/reference ratios. Representative immunohistochemistry with rabbit anti-axin2 antibodies in normal pancreas (bottom left) and pancreatic adenocarcinoma (bottom right).

References

    1. Kern S, Hruban R, Hollingsworth MA, Brand R, Adrian TE, et al. A white paper: the product of a pancreas cancer think tank. Cancer Res. 2001;61:4923–4932. - PubMed
    1. Ryu B, Jones J, Blades NJ, Parmigiani G, Hollingsworth MA, et al. Relationships and differentially expressed genes among pancreatic cancers examined by large-scale serial analysis of gene expression. Cancer Res. 2002;62:819–826. - PubMed
    1. Terris B, Blaveri E, Crnogorac-Jurcevic T, Jones M, Missiaglia E, et al. Characterization of gene expression profiles in intraductal papillary-mucinous tumors of the pancreas. Am J Pathol. 2002;160:1745–1754. - PMC - PubMed
    1. Logsdon CD, Simeone DM, Binkley C, Arumugam T, Greenson JK, et al. Molecular profiling of pancreatic adenocarcinoma and chronic pancreatitis identifies multiple genes differentially regulated in pancreatic cancer. Cancer Res. 2003;63:2649–2657. - PubMed
    1. Iacobuzio-Donahue CA, Maitra A, Olsen M, Lowe AW, Van Heek NT, et al. Exploration of global gene expression patterns in pancreatic adenocarcinoma using cDNA microarrays. Am J Pathol. 2003;162:1151–1162. - PMC - PubMed

Publication types

MeSH terms