. 2007 Apr;170(4):1370-8.
doi: 10.2353/ajpath.2007.060754.

Bmi-1 is essential for the tumorigenicity of neuroblastoma cells

Affiliations

Bmi-1 is essential for the tumorigenicity of neuroblastoma cells

Hongjuan Cui et al. Am J Pathol. 2007 Apr.

Abstract

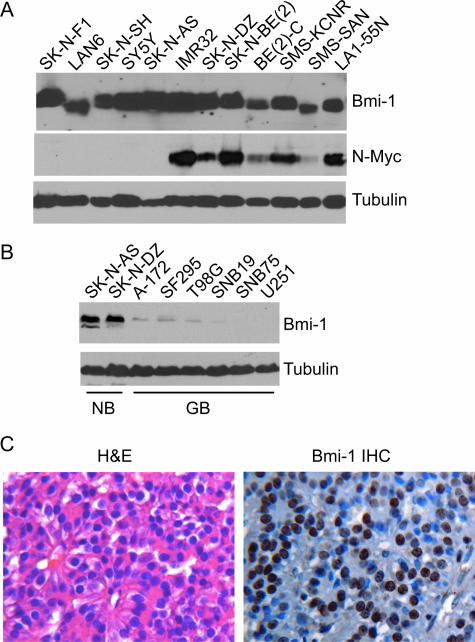
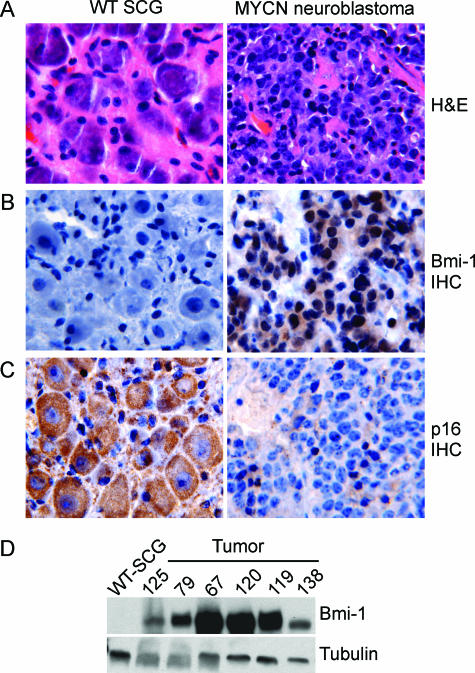
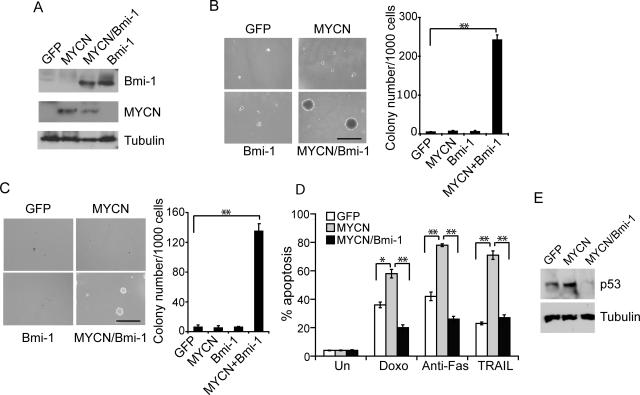
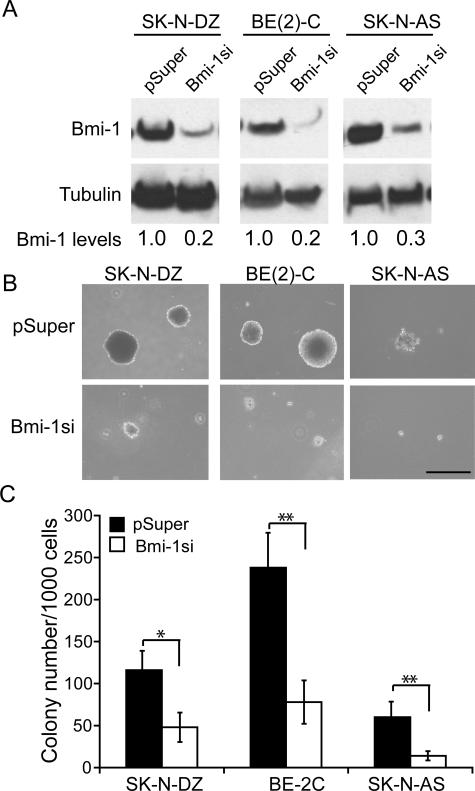
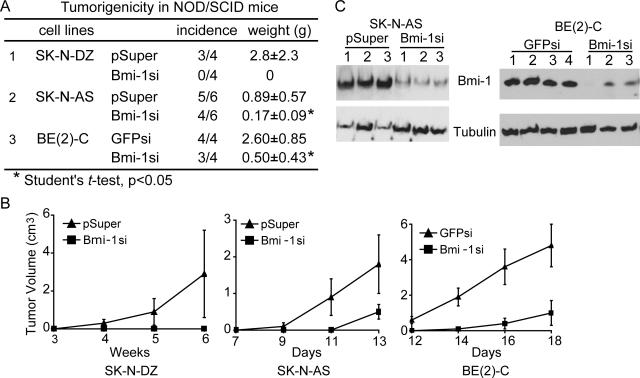
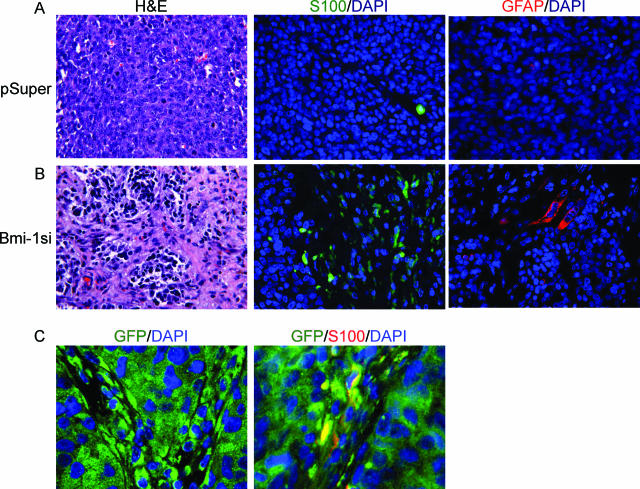
Activation of oncogenes underlies the pathogenesis of most human cancers. In neuroblastoma, amplification of the oncogene MYCN occurs in approximately 22% of cases and is associated with advanced stages of the disease and poor prognosis. Identification of other oncogenes that are consistently mutated or overexpressed in neuroblastoma is crucial for a molecular understanding of the pathogenic process. Here, we report that the oncogene Bmi-1 is highly expressed in human neuroblastoma cell lines and primary tumors. Neuroblastoma development in MYCN transgenic mice, an animal model for the human disease, was associated with a marked increase in the levels of Bmi-1 expression. Bmi-1 cooperated with MYCN in transformation of benign S-type neuroblastoma cells and avian neural crest cells by inhibiting the apoptotic activity of MYCN. Importantly, down-regulation of Bmi-1 impaired the ability of neuroblastoma cells to grow in soft agar and induce tumors in immunodeficient mice. Moreover, Bmi-1-knockdown neuroblastoma xenografts were characterized by a significant increase in the amount of Schwannian stroma, a histological feature associated with clinically favorable neuroblastomas. These findings suggest a crucial role for Bmi-1 in neuroblastoma pathogenesis and provide insights into the molecular basis of neuroblastoma heterogeneity.


Figures

Figure 1
Figure 1
Bmi-1 is highly expressed in human neuroblastoma cell lines and primary tumors. A and B: Immunoblot analysis of Bmi-1 and/or MYCN expression in neuroblastoma (NB) and glioblastoma (GB) cell lines. α-Tubulin levels are shown as loading control. C: Left, H&E staining of a representative primary human neuroblastoma sample; right, immunohistochemical (IHC) staining for Bmi-1 expression in the same tumor sample. A significant number of tumor cells show strong nuclear staining of Bmi-1 (brown). Original magnifications, ×400.
Figure 2
Figure 2
Bmi-1 is highly expressed in primary neuroblastoma tumors from MYCN transgenic mice. A: H&E staining of an SCG (left) from an 8-week-old wild-type mouse and a neuroblastoma sample (right) from a homozygous MYCN mouse of the same age. Note the large mature ganglion cells in the SCG. The neuroblastoma tumor is composed of mostly small blue cells (neuroblasts). B and C: Immunohistochemical staining of the same SCG and neuroblastoma samples for Bmi-1 (B) and p16Ink4a (C) expression (brown). Cells were counterstained with hematoxylin. Original magnifications, ×400. D: Immunoblot analysis of Bmi-1 expression in wild-type SCG and MYCN neuroblastoma tumors. α-Tubulin levels are shown as loading control.
Figure 3
Figure 3
Bmi-1 cooperates with MYCN in transformation. A: Immunoblot analysis of Bmi-1 and MYCN overexpression in SHEP1 cells. α-Tubulin levels are shown as loading control. B and C: Soft agar colony growth by the indicated SHEP1 cell lines and quail neural crest cells after 14 to 21 days of culture. Also shown are numbers of colonies per 1000 plating cells. Colonies that contained more than 50 cells or were larger than 0.5 mm were scored. Each bar represents the average ± SD of three independent experiments. Scale bars = 2 mm. D: Bmi-1 abrogates MYCN-induced sensitization of SHEP1 cells to apoptosis induced by the DNA damage drug doxorubicin (0.5 μg/ml), agonistic anti-Fas antibody (0.5 μg/ml), or TRAIL (0.1 μg/ml). Cells were collected 24 hours after treatment and analyzed for apoptosis by annexin-V staining. Each bar represents the average ± SD of three independent experiments. Statistical analyses (B–D) were performed using two-tailed Student’s t-test; *P < 0.05; **P < 0.01. E: Immunoblot analysis of p53 expression in SHEP1 cells expressing GFP, MYCN, or MYCN and Bmi-1. α-Tubulin levels are shown as loading control.
Figure 4
Figure 4
Down-regulation of Bmi-1 inhibits the clonogenic activity of neuroblastoma cells. A: Immunoblot analysis of the indicated neuroblastoma cell lines for Bmi-1 knockdown by siRNA. Relative levels of Bmi-1 are indicated. α-Tubulin levels are shown as loading control. B: Soft agar colony growth by the indicated neuroblastoma cell lines after 14 to 21 days of culture. Scale bar = 2 mm. C: Numbers of colonies per 1000 plating cells. Colonies that contained more than 50 cells or were larger than 0.5 mm were scored. Each bar represents the average ± SD of three independent experiments. Statistical analysis was performed using two-tailed Student’s t-test; *P < 0.05; **P < 0.01.
Figure 5
Figure 5
Down-regulation of Bmi-1 inhibits the tumorigenicity of neuroblastoma cells. A: Tumorigenic activity exhibited by the indicated neuroblastoma cell lines. B: Tumor growth in NOD/SCID mice injected with indicated human neuroblastoma cell lines, as estimated by caliper measurements. C: Immunoblot analysis of Bmi-1 expression in mouse neuroblastoma xenografts derived from indicated human neuroblastoma cell lines. α-Tubulin levels are shown as loading control.
Figure 6
Figure 6
Bmi-1 knockdown promotes the development of Schwannian stroma in neuroblastoma xenografts. A and B: Histological and immunofluorescent examination of tumor xenografts derived from SK-N-AS/pSuper (A) and SK-N-AS/Bmi-1si cells (B). Left: H&E staining for small blue neuroblasts and fibrous stromal tissue; middle: immunofluorescent staining for S100 expression (green); and right: immunofluorescent staining for glial fibrillary acidic protein (GFAP) expression (red). C: Immunofluorescent staining for GFP (green) or GFP and S100 (yellow) expression in tumor xenografts derived from SK-N-AS/Bmi-1si/GFP cells. Nuclei were stained with 4′,6′-diamidino-2-phenylindole (DAPI). Original magnifications: ×200 (A, B); ×600 (C).

References

    1. Brodeur GM. Neuroblastoma: biological insights into a clinical enigma. Nat Rev Cancer. 2003;3:203–216. - PubMed
    1. Schwab M. MYCN in neuronal tumours. Cancer Lett. 2004;204:179–187. - PubMed
    1. Weiss WA, Aldape K, Mohapatra G, Feuerstein BG, Bishop JM. Targeted expression of MYCN causes neuroblastoma in transgenic mice. EMBO J. 1997;16:2985–2995. - PMC - PubMed
    1. Maris JM, Matthay KK. Molecular biology of neuroblastoma. J Clin Oncol. 1999;17:2264–2279. - PubMed
    1. Haupt Y, Bath ML, Harris AW, Adams JM. Bmi-1 transgene induces lymphomas and collaborates with myc in tumorigenesis. Oncogene. 1993;8:3161–3164. - PubMed

Publication types

MeSH terms