. 2007 Apr 3;104(14):5947-52.
doi: 10.1073/pnas.0700638104. Epub 2007 Mar 28.

Regulation of Caenorhabditis elegans lifespan by a proteasomal E3 ligase complex

Affiliations

Regulation of Caenorhabditis elegans lifespan by a proteasomal E3 ligase complex

Arjumand Ghazi et al. Proc Natl Acad Sci U S A. .

Abstract

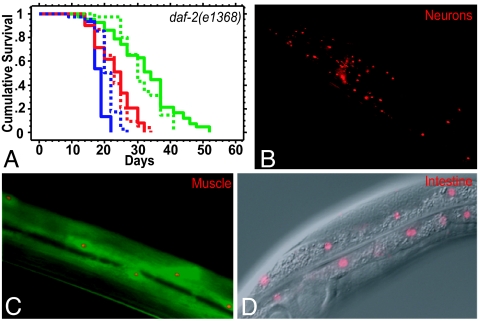
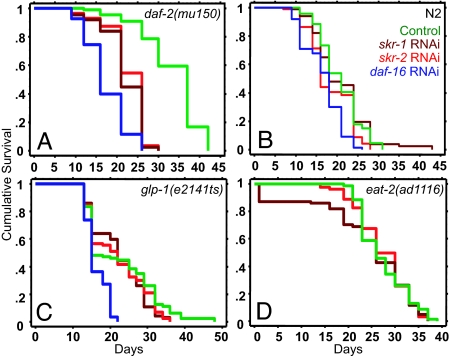
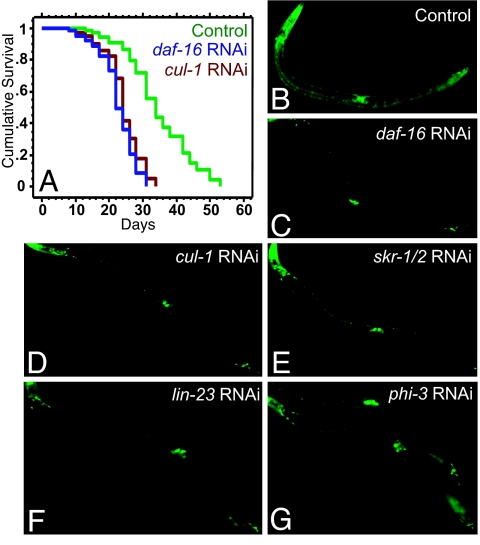
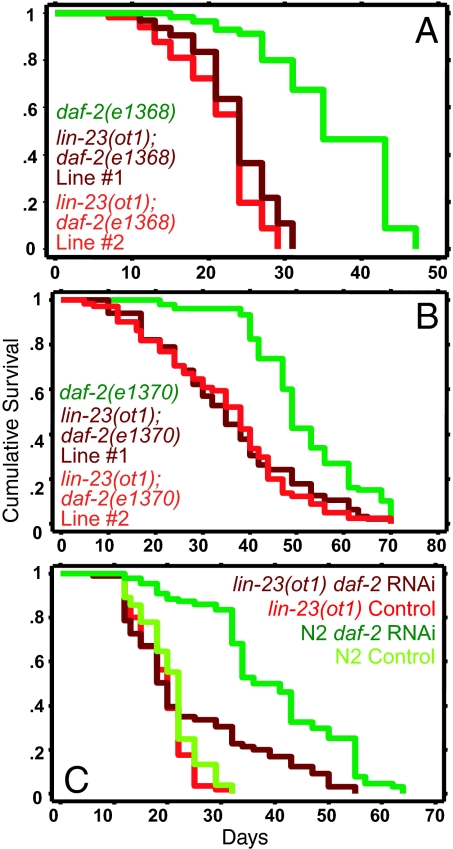
The proteasome maintains cellular homeostasis by degrading oxidized and damaged proteins, a function known to be impaired during aging. The proteasome also acts in a regulatory capacity through E3 ligases to mediate the spatially and temporally controlled breakdown of specific proteins that impact biological processes. We have identified components of a Skp1-Cul1-F-Box E3 ligase complex that are required for the extended lifespan of Caenorhabditis elegans insulin/insulin-like growth factor-1-signaling (IIS) mutants. The CUL-1 complex functions in postmitotic, adult somatic tissues of IIS mutants to enhance longevity. Reducing IIS function leads to the nuclear accumulation of the DAF-16/FOXO transcription factor, which extends lifespan by regulating downstream longevity genes. These CUL-1 complex genes act, at least in part, by promoting the transcriptional activity of DAF-16/FOXO. Together, our findings describe a role for an important cellular pathway, the proteasomal pathway, in the genetic determination of lifespan.


Conflict of interest statement

The authors declare no conflict of interest.

Figures

Fig. 1.
Fig. 1.
cul-1 RNAi shortens the extended lifespan of daf-2 mutants. (A) Schematic representation of the CUL-1 E3 ligase complex. (B–G) Lifespan curves of long-lived mutants and wild-type worms grown as adults on control empty vector (green lines), daf-16 RNAi (blue lines), and cul-1 RNAi (red lines). (B) daf-2(mu150). Control vector: mean = 33.4 ± 0.7, n = 89/90 (number of animals that died/total; see Materials and Methods); daf-16 RNAi: mean = 17.3 ± 0.5, n = 80/83, P < 0.0001 vs. control; cul-1 RNAi: mean = 25.2 ± 0.4, n = 80/85, P < 0.0001 vs. control. (C) daf-2(e1368). Control vector: mean = 32.7 ± 0.7, n = 58/105; daf-16 RNAi: mean = 22.1 ± 0.3, n = 76/105, P < 0.0001 vs. control; cul-1 RNAi: mean = 25.1 ± 0.4, n = 69/104, P < 0.0001 vs. control. (D) daf-2(e1370). Control vector: mean = 40.8 ± 1.0, n = 72/89; daf-16 RNAi: mean = 22.7 ± 0.5, n = 67/90, P < 0.0001 vs. control; cul-1 RNAi: mean = 31.1 ± 0.9, n = 77/83, P < 0.0001 vs. control. (E) N2. Control vector: mean = 20.7 ± 0.7, n = 67/88; daf-16 RNAi: mean = 16.6 ± 0.5, n = 67/87, P < 0.0001 vs. control; cul-1 RNAi: mean = 18.8 ± 0.6, n = 84/90, P = 0.3 vs. control. (F) glp-1(e2141ts). Control vector: mean = 23.2 ± 0.4, n = 86/87; daf-16 RNAi: mean = 17.8 ± 0.4, n = 79/84, P < 0.0001 vs. control; cul-1 RNAi: mean = 23.9 ± 0.3, n = 74/76, P = 0.4 vs. control. (G) eat-2(ad1116). Control vector: mean = 27.3 ± 0.6, n = 70/96; daf-16 RNAi: mean = 24.8 ± 0.6, n = 68/96, P = 0.005 vs. control; cul-1 RNAi: mean = 25.2 ± 0.5, n = 77/102, P = 0.2 vs. control.
Fig. 2.
Fig. 2.
cul-1 acts in postmitotic adult somatic tissues to regulate the lifespan of daf-2 mutants. (A) cul-1 RNAi shortens the extended lifespan of gonad-ablated daf-2 mutants. Lifespans of gonad precursor (Z1 and Z4) ablated daf-2(e1368) mutants (solid lines) and unablated control worms (dotted lines) grown as adults on bacteria expressing dsRNA for cul-1 (red), daf-16 (blue), and control vector (green) are shown. Z1,Z4(−) control vector (green solid line): mean = 32.6 ± 1.4, n = 43/43; Z1,Z4(−) cul-1 RNAi (red solid line): mean = 23.0 ± 0.6, n = 54/54, P < 0.0001 vs. control; Z1,Z4(−) daf-16 RNAi (blue solid line): mean = 18.2 ± 0.36, n = 30/30, P < 0.0001 vs. control; unablated control vector (green dotted line): mean = 31.4 ± 1.0, n = 35/43; unablated cul-1 RNAi (red dotted line): mean = 23.1 ± 0.9, n = 39/45, P < 0.0001 vs. control; unablated daf-16 RNAi (blue dotted line): mean = 20.8 ± 0.5, n = 40/45, P < 0.0001 vs. control. Similar results were obtained with additional repetitions of this experiment (SI Table 3). (B–D) cul-1 expression in adult somatic tissues. A Pcul-1::rfp construct reveals expression in adult neurons (head neurons are shown in B), muscles (C; colocalization with Pmyo-3::gfp coinjection marker), and intestinal cells (D; composite fluorescence-differential interference contrast microscopy image). The red fluorescent protein signal appears nuclear because of the presence of a nuclear localization signal in the construct for ease of cell identification.
Fig. 3.
Fig. 3.
skr-1/2 are required for the extended lifespan of daf-2 mutants but not other long-lived mutants or wild-type worms. Lifespan experiments of long-lived mutants and wild-type worms grown as adults on control empty vector (green lines), daf-16 RNAi (blue lines), skr-1 RNAi (deep red lines), and skr-2 RNAi (bright red lines). (A) daf-2(mu150). Control vector: mean = 33.4 ± 0.7, n = 89/90; daf-16 RNAi: mean = 17.3 ± 0.5, n = 80/83, P < 0.0001 vs. control; skr-1 RNAi: mean = 22.0 ± 0.5, n = 88/91, P < 0.0001 vs. control; skr-2 RNAi: mean = 22.8 ± 0.4, n = 92/92, P < 0.0001 vs. control. (B) N2. Control vector: mean = 20.7 ± 0.7, n = 67/88; daf-16 RNAi: mean = 16.6 ± 0.5, n = 67/87, P < 0.0001 vs. control; skr-1 RNAi: mean = 20.7 ± 0.7, n = 82/86, P = 0.71 vs. control; skr-2 RNAi: mean = 21.4 ± 0.9, n = 67/81, P = 0.19 vs. control. (C) glp-1(e2141ts). Control vector: mean = 22.4 ± 1.0, n = 82/85; daf-16 RNAi: mean = 16.1 ± 0.3, n = 88/88, P < 0.0001 vs. control; skr-1 RNAi: mean = 21.8 ± 0.8, n = 88/91, P = 0.19 vs. control; skr-2 RNAi: mean = 22.1 ± 0.7, n = 92/92, P = 0.1 vs. control. (D) eat-2(ad1116). Control vector: mean = 27.3 ± 0.6, n = 70/96; skr-1 RNAi: mean = 23.8 ± 1.1, n = 66/94, P = 0.2 vs. control; skr-2 RNAi: mean = 27.3 ± 0.6, n = 67/93, P = 0.8 vs. control.
Fig. 4.
Fig. 4.
Effects of RNAi inactivation of F-Box adaptors on lifespan. Lifespan experiments with long-lived mutants and wild-type worms subjected as adults to feeding RNAi for control vector (green lines), daf-16 (blue lines), and genes encoding the following F-Box adaptor proteins: lin-23 (red lines), F59B2.8 (orange lines), fbxa-121 (pink lines), and phi-3 (gray lines). (A) daf-2(mu150). Control vector: mean = 37.8 ± 0.5, n = 80/91; daf-16 RNAi: mean = 17.8 ± 0.3, n = 92/92, P < 0.0001 vs. control; lin-23 RNAi: mean = 26.7 ± 0.3, n = 78/84, P < 0.0001 vs. control; F59B2.8 RNAi: mean = 24.4 ± 0.7, n = 86/87, P < 0.0001 vs. control; fbxa-121 RNAi: mean = 25.8 ± 0.9, n = 81/86, P < 0.0001 vs. control; phi-3 RNAi: mean = 27.0 ± 0.4, n = 84/84, P < 0.0001 vs. control. (B) N2. Control vector: mean = 18.6 ± 0.8, n = 70/88; daf-16 RNAi: mean = 15.6 ± 0.4, n = 86/90, P < 0.0001 vs. control; lin-23 RNAi: mean = 18.6 ± 0.6, n = 82/94, P = 0.68 vs. control, P < 0.0001 vs. daf-16 RNAi; F59B2.8 RNAi: mean = 17.5 ± 0.5, n = 74/89, P = 0.07 vs. control, P = .06 vs. daf-16 RNAi; fbxa-121 RNAi: mean = 18.3 ± 0.7, n = 59/86, P = 0.64 vs. control, P = 0.02 vs. daf-16 RNAi; phi-3 RNAi: mean = 15.7 ± 0.5, n = 80/91, P = .007 vs. control, P = 0.31 vs. daf-16 RNAi. (C) glp-1(e2141ts). Control vector: mean = 22.4 ± 1.0, n = 82/85; daf-16 RNAi: mean = 16.1 ± 0.3, n = 88/88, P < 0.0001 vs. control; lin-23 RNAi: mean = 17.9 ± 0.4, n = 85/90, P < 0.0001 vs. control; F59B2.8 RNAi: mean = 16.8 ± 0.3, n = 85/88, P < 0.0001 vs. control; fbxa-121 RNAi: mean = 17.0 ± 0.4, n = 90/90, P < 0.0001 vs. control; phi-3 RNAi: mean = 22.2 ± 0.7, n = 92/94, P = 0.2 vs. control. (D) eat-2(ad1116). Control vector: mean = 27.3 ± 0.6, n = 70/96; lin-23 RNAi: mean = 23.0 ± 0.9, n = 85/90, P < 0.02 vs. control; F59B2.8 RNAi: mean = 16.6 ± 0.4, n = 64/96, P < 0.0001 vs. control; fbxa-121 RNAi: mean = 20.2 ± 0.9, n = 90/90, P < 0.0001 vs. control; phi-3 RNAi: mean = 29.5 ± 0.7, n = 74/94, P = 0.008 vs. control.
Fig. 5.
Fig. 5.
RNAi of cul-1 complex genes affects DAF-16 transcriptional activity. (A) daf-16(mu86); daf-2(e1370); Pdaf-16::daf-16AM::gfp worms were subjected to RNAi treatment from day 1 of adulthood. Empty vector control (green curve): mean = 34.6 ± 0.6, n = 94/102; daf-16 RNAi (blue curve): mean = 22.7 ± 0.7; n = 84/90, P < 0.0001 vs. control; cul-1 RNAi (red curve): mean = 24.3 ± 0.3, n = 95/104, P < 0.0001 vs. control. (B–G) daf-2(e1370); Psod-3::gfp worms subjected to RNAi of cul-1 complex genes from the L4 stage through day 2 of adulthood. sod-3 expression is increased in daf-2 mutants (B) in a daf-16-dependent manner (C). This increased expression is significantly reduced in RNAi of cul-1 (D), skr-1/2 (E), and lin-23 (F). A milder, variable effect was observed on phi-3 RNAi (G). Data from multiple trials are shown in SI Table 5. Bar graph representation is found in SI Fig. 7.
Fig. 6.
Fig. 6.
A mutation in the PAPP domain of lin-23 shortens the extended lifespan of daf-2 mutants. (A and B) The lin-23(ot1) mutation shortens the extended lifespan of daf-2 mutants. (A) daf-2(e1368) (green curve): mean = 36.3 ± 1.1, n = 43/72; lin-23(ot1); daf-2(e1368) line #2 (bright red curve): mean = 21.6 ± 0.7, n = 46/68, P < 0.0001 vs. control; lin-23(ot1); daf-2(e1368) line #1 (deep red curve): mean = 23.7 ± 0.6, n = 56/86, P < 0.0001 vs. control. (B) daf-2(e1370) (green curve): mean = 55.2 ± 2.0, n = 58/86; lin-23(ot1); daf-2(e1370) line #1 (deep red curve): mean = 37.4 ± 2.2, n = 41/79, P < 0.0001 vs. control; lin-23(ot1); daf-2(e1370) line #2 (bright red curve): mean = 38.8 ± 1.6, n = 57/90, P < 0.0001 vs. control. In the above experiments, worms were grown at 20°C on normal food (OP50) for their entire life. (C) lin-23(ot1) mutants display significantly reduced lifespan extension in response to daf-2 RNAi as compared with wild-type worms. lin-23(ot1) mutants grown at 20°C on normal OP50 bacteria from hatching until L4 and then shifted to feeding RNAi bacteria expressing dsRNA for the control empty vector (bright red curve, mean = 19.1 ± 0.5, n = 62/106) and daf-2 (deep red curve, mean = 24.3 ± 1.5, n = 68/105, P < 0.0001 vs. control). N2 worms grown under similar conditions on control empty vector (bright green curve, mean = 20.7 ± 0.6, n = 58/111) and daf-2 RNAi (deep green curve, mean = 39.7 ± 1.4, n = 74/106, P < 0.0001 vs. control). Similar results were obtained when the worms were grown at 20°C during development and transferred to 25°C as adults, except with daf-2(e1370). lin-23(ot1) extended the lifespan of daf-2(e1370) mutants at 25°C (SI Table 6).

References

    1. Gaczynska M, Osmulski PA, Ward WF. Mech Ageing Dev. 2001;122:235–254. - PubMed
    1. Hershko A, Ciechanover A. Annu Rev Biochem. 1998;67:425–479. - PubMed
    1. Willems AR, Schwab M, Tyers M. Biochim Biophys Acta. 2004;1695:133–170. - PubMed
    1. Kenyon C. Cell. 2005;120:449–460. - PubMed
    1. Kenyon C, Chang J, Gensch E, Rudner A, Tabtiang R. Nature. 1993;366:461–464. - PubMed

Publication types

MeSH terms

Substances

LinkOut - more resources