. 2007 Jun;18(6):2112-22.
doi: 10.1091/mbc.e07-01-0071. Epub 2007 Mar 28.

Gangliosides GM1 and GM3 in the living cell membrane form clusters susceptible to cholesterol depletion and chilling

Affiliations

Gangliosides GM1 and GM3 in the living cell membrane form clusters susceptible to cholesterol depletion and chilling

Akikazu Fujita et al. Mol Biol Cell. 2007 Jun.

Abstract

Presence of microdomains has been postulated in the cell membrane, but two-dimensional distribution of lipid molecules has been difficult to determine in the submicrometer scale. In the present paper, we examined the distribution of gangliosides GM1 and GM3, putative raft molecules in the cell membrane, by immunoelectron microscopy using quick-frozen and freeze-fractured specimens. This method physically immobilized molecules in situ and thus minimized the possibility of artifactual perturbation. By point pattern analysis of immunogold labeling, GM1 was shown to make clusters of <100 nm in diameter in normal mouse fibroblasts. GM1-null fibroblasts were not labeled, but developed a similar clustered pattern when GM1 was administered. On cholesterol depletion or chilling, the clustering of both endogenous and exogenously-loaded GM1 decreased significantly, but the distribution showed marked regional heterogeneity in the cells. GM3 also showed cholesterol-dependent clustering, and although clusters of GM1 and GM3 were found to occasionally coincide, these aggregates were separated in most cases, suggesting the presence of heterogeneous microdomains. The present method enabled to capture the molecular distribution of lipids in the cell membrane, and demonstrated that GM1 and GM3 form clusters that are susceptible to cholesterol depletion and chilling.


Figures
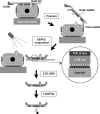
Figure 1.
Figure 1.
Outline of the SDS-FRL technique used in the present study. Cells cultured on thin gold foils were quick-frozen and freeze-fractured. Replicas were made by evaporation of carbon followed by platinum/carbon in most experiments. The replicas were treated with SDS and labeled with antibodies.
Figure 2.
Figure 2.
Fibroblasts obtained from GM1-null mice were cultured with or without 0.3, 3, or 30 μM GM1 for 60 min. (A) Dot blot labeling by b-CtxB. (B) Fluorescence microscopy using b-CtxB, followed by fluorescein isothiocyanate-avidin. The addition of GM1 to the culture medium increases the GM1 content in GM1-null mouse fibroblasts. Scale bar, 10 μm. (C) Freeze-fracture replicas were labeled by anti-GM1 antibody (top row), or by b-CtxB (bottom row). With either probe, labeling was not observed without GM1 loading, and labeling increased according to the amount of loading. Labeling of GM3 was observed without GM1 loading (inset). Ten-nanometer colloidal gold was used for labeling.
Figure 3.
Figure 3.
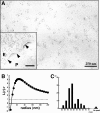
Labeling of freeze-fracture replicas of normal mouse fibroblasts by rabbit anti-GM1 antibody and colloidal gold (5-nm)-conjugated anti-rabbit IgG F(ab′)2 fragment (GAR-Fab5). (A) GM1 labeling by 5-nm colloidal gold particles was detectable as clusters in the E face of the freeze-fractured plasma membrane. Inset, the P face was unlabeled. The cell boundary is marked by arrowheads. Ten-nanometer colloidal gold was used for labeling in this sample. (B) Fifty areas (1 × 1 μm) were randomly photographed, and the gold point patterns were analyzed by Ripley's K-function. The mean L(r)r curve showed maximal deflection from CSR (99% CI is shown by a dotted line) at a 47.0-nm radius. (C) Radii of maximal deflection for 50 sample areas ranging from 32 to 68 nm, with only one area showing no apparent peak.
Figure 4.
Figure 4.
Analysis of GM1 distribution in normal mouse fibroblasts under three different conditions: control, cholesterol depletion, and incubation on ice for 30 min. (A) Mean L(r)r curves. The pooled data show clustering even after cholesterol depletion or chilling, but deviation from CSR was considerably smaller than the control. (B) Radii of maximal deflection in 50 areas. L(r)r curves without any peak below r = 200 nm increased after either treatment. (C) Classification based on K-function analysis. Areas showing more than one point above the 99% CI below r = 100 nm were regarded as clustered. (D) Classification of 10 randomly chosen cells. The entire area in each cell was analyzed. Cells were classified by whether they showed clustered areas only or both clustered and random areas. (E) NND analysis. NND values increased significantly after cholesterol depletion or chilling, compared with control cells (Student's t test; **p < 0.005, ***p < 0.001). (F) The average labeling density showed a wide range for each sample and increased significantly after cholesterol depletion or chilling (Student's t test; *p < 0.05, ***p < 0.001). (G) NND normalized to the value expected for random distribution. Only the control sample showed a value significantly <1 (***p < 0.001). (H) Correlation of NND and the average labeling density. The dependence of NND upon the labeling density was far less in the control than in the treated samples.
Figure 5.
Figure 5.
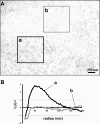
GM1 labeling in mouse fibroblasts treated with 5 mM MβCD for 60 min. (A) The labeling shows a marked regional heterogeneity in most cells. (B) The gold point patterns of adjacent areas in A show clustered (a) and random (b) distributions, respectively.
Figure 6.
Figure 6.
Changes observed after cholesterol depletion and chilling in normal mouse fibroblasts were also observed in GM1-null fibroblasts loaded with exogenous GM1. (A) The mean L(r)r curve shows a decrease of clustering after cholesterol depletion by MβCD or after chilling. The change was more drastic by cholesterol depletion than by chilling. (B and C) The proportion of areas showing random distribution as well as the average labeling density also increased significantly by cholesterol depletion or chilling.
Figure 7.
Figure 7.
Distribution of PC labeled by mouse anti-PC antibody (IgM) and colloidal gold (5-nm)-conjugated goat anti-mouse Ig antibody. (A) The labeling of PC in the normal mouse fibroblast was observed as clusters in the E face, which was similar to that seen in liposomes and in other cell types (Fujimoto et al., 1996). (B) The K-function analysis of 10 areas (1 × 1 μm) showed that the labeling was clustered in the normal mouse fibroblast. The clustering was observed similarly in cells depleted of cholesterol, but it decreased in chilled cells.
Figure 8.
Figure 8.
GM3 labeling in normal mouse fibroblasts. (A) Thirty randomly chosen areas (1 × 1 μm) were analyzed by Ripley's K-function. In contrast to GM1, the mean L(r)r curve of GM3 did not show any apparent deflection below r = 200 nm. (B) The mean L(r)r curve became lower after cholesterol depletion. (C) Classification of the 30 areas according to K-function analysis. Cholesterol depletion caused an increase in the number of areas with random distribution.
Figure 9.
Figure 9.
Double labeling of GM1 and GM3 in normal mouse fibroblasts. (A) GM1 and GM3 were marked with colloidal gold particles of different sizes, which were colored artificially: GM1, black; GM3, orange. (B) Analysis of the two areas shown in A by using a bivariate K-function. GM1 and GM3 were found to be coclustered in the left sample, but they segregated from each other in the right sample. Coclustering as shown in the left graph was seen only in 13.3% of the cases.

Comment in

Similar articles

Cited by

References

    1. Brugger B., Graham C., Leibrecht I., Mombelli E., Jen A., Wieland F., Morris R. The membrane domains occupied by glycosylphosphatidylinositol-anchored prion protein and Thy-1 differ in lipid composition. J. Biol. Chem. 2004;279:7530–7536. - PubMed
    1. Chandler D. E. Comparison of quick-frozen and chemically fixed sea-urchin eggs: structural evidence that cortical granule exocytosis is preceded by a local increase in membrane mobility. J. Cell Sci. 1984;72:23–36. - PubMed
    1. Chen X., Resh M. D. Cholesterol depletion from the plasma membrane triggers ligand-independent activation of the epidermal growth factor receptor. J. Biol. Chem. 2002;277:49631–49637. - PubMed
    1. Chigorno V., Palestini P., Sciannamblo M., Dolo V., Pavan A., Tettamanti G., Sonnino S. Evidence that ganglioside enriched domains are distinct from caveolae in MDCK II and human fibroblast cells in culture. Eur. J. Biochem. 2000;267:4187–4197. - PubMed
    1. Dietrich C., Bagatolli L. A., Volovyk Z. N., Thompson N. L., Levi M., Jacobson K., Gratton E. Lipid rafts reconstituted in model membranes. Biophys. J. 2001a;80:1417–1428. - PMC - PubMed

Publication types

MeSH terms