. 2007 Apr;18(4):1385-96.
doi: 10.1091/mbc.e06-12-1120. Epub 2007 Feb 7.

Ataxin-2 interacts with the DEAD/H-box RNA helicase DDX6 and interferes with P-bodies and stress granules

Affiliations

Ataxin-2 interacts with the DEAD/H-box RNA helicase DDX6 and interferes with P-bodies and stress granules

Ute Nonhoff et al. Mol Biol Cell. 2007 Apr.

Abstract

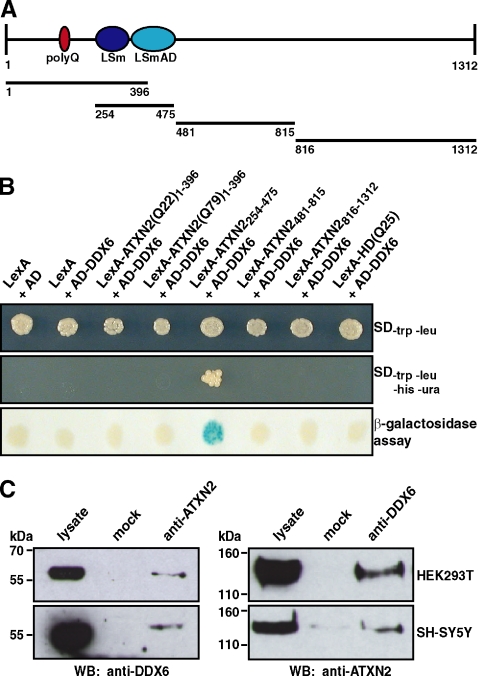
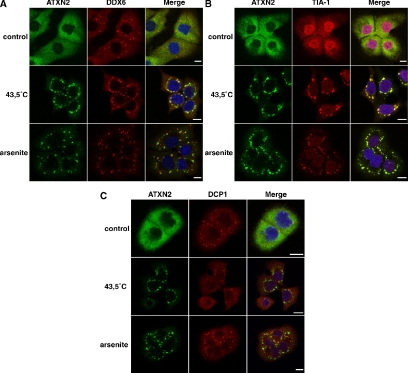
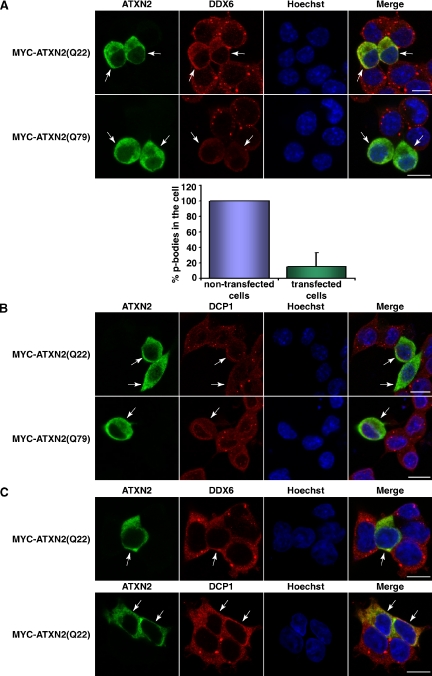
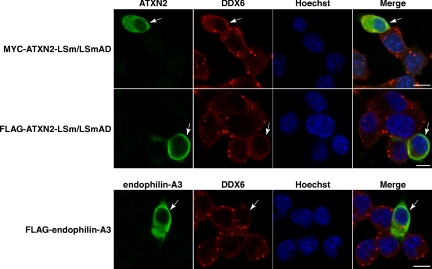
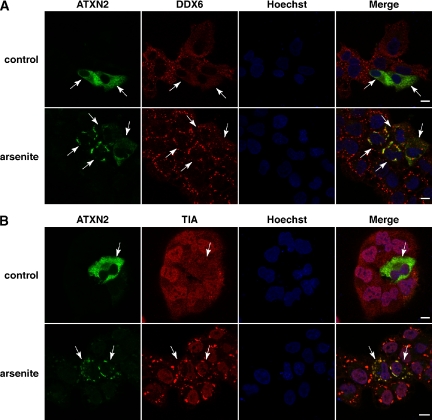
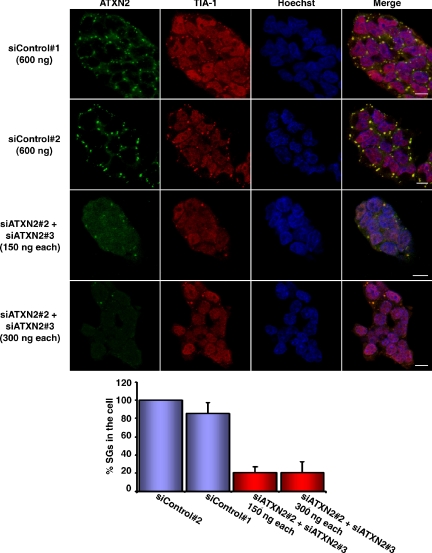
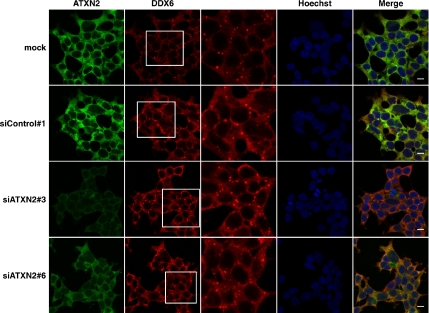
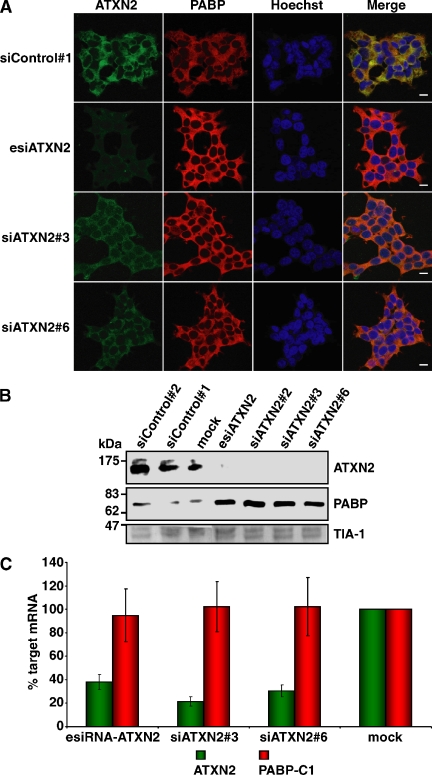
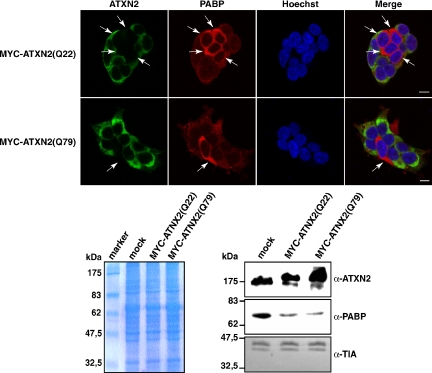
Tight control of translation is fundamental for eukaryotic cells, and deregulation of proteins implicated contributes to numerous human diseases. The neurodegenerative disorder spinocerebellar ataxia type 2 is caused by a trinucleotide expansion in the SCA2 gene encoding a lengthened polyglutamine stretch in the gene product ataxin-2, which seems to be implicated in cellular RNA-processing pathways and translational regulation. Here, we substantiate a function of ataxin-2 in such pathways by demonstrating that ataxin-2 interacts with the DEAD/H-box RNA helicase DDX6, a component of P-bodies and stress granules, representing cellular structures of mRNA triage. We discovered that altered ataxin-2 levels interfere with the assembly of stress granules and cellular P-body structures. Moreover, ataxin-2 regulates the intracellular concentration of its interaction partner, the poly(A)-binding protein, another stress granule component and a key factor for translational control. Thus, our data imply that the cellular ataxin-2 concentration is important for the assembly of stress granules and P-bodies, which are main compartments for regulating and controlling mRNA degradation, stability, and translation.


Figures

Figure 1.
Figure 1.
Interaction between ATXN2 and the DEAD/H-box RNA helicase DDX6. (A) Schematic illustration of ATXN2. Ellipses represent the polyQ-region (dark red), LSm and LSmAD domain (dark blue and light blue, respectively). Bars below display ATXN2 regions used in the directed yeast two-hybrid analysis. (B) Yeast two-hybrid analysis. Yeast strain L40ccua was transformed with the respective plasmids to coexpress the different LexA and AD fusion proteins as indicated. Afterward, transformants were isolated and spotted on selective media or on a membrane to analyze the activity of the reporter genes. (C) Coimmunoprecipitation. Cell lysates were prepared from HEK293T and SH-SY5Y cells. Coimmunoprecipitation was performed with 5 μl of α-ATXN2 antibody (left) or 1 μl of α-DDX6 antibody (right). Precipitated proteins were visualized with the antibodies indicated.
Figure 2.
Figure 2.
ATXN2 and DDX6 colocalize in stress granules. DU145 cells were treated with 0.5 mM arsenite or heat shocked at 43.5°C for 1 h. Control cells were left untreated at 37°C. Colocalization of endogenous ATXN2 and DDX6 (A), TIA-1 (B), or DCP1 (C). Nuclei were stained with Hoechst. Bars, 10 μm.
Figure 3.
Figure 3.
ATXN2 overexpression interferes with P-body assembly. (A) SH-SY5Y cells were transiently transfected with plasmids pCMV-MYC-ATXN2-Q22 or pCMV-MYC-ATXN2-Q79. For staining exogenous ATXN2 and endogenous DDX6, cells were incubated with antibodies directed against the MYC-tag and DDX6, followed by treatment with secondary antibodies coupled to FITC or Cy3, respectively. For quantitative analysis, the percentage of P-bodies in nontransfected versus transfected cells was calculated using the AxioVision software. Here, P-bodies of cells were counted in each picture taken and divided through the cell number. The mean value of P-bodies in the cells counted was calculated and SD was weighted. Then, the number of P-bodies counted for the nontransfected cells was set as 100%, and the number of P-bodies counted for the transfected cells was aligned. (B) Twenty-four hours after transfection, SH-SY5Y cells transiently overexpressing MYC-ATXN2(Q22) or MYC-ATXN2(Q79) or HEK293T transiently overexpressing MYC-ATXN2(Q22) (C) were stained for the MYC-tag and DDX6 or DCP1, respectively. Nuclei were stained with Hoechst. Bars, 10 μm. Arrows indicate transfected cells.
Figure 4.
Figure 4.
The LSm/LSmAD domain of ATXN2 is accountable for the interference with P-body structures. SH-SY5Y cells were transiently transfected with plasmid pCMV-MYC-ATXN2-LSm/LSmAD or pTL-FLAG-ATXN2-LSm/LSmAD. For staining exogenous ATXN2 and endogenous DDX6, cells were incubated with antibodies directed against the MYC- or FLAG-tag and DDX6, followed by treatment with secondary antibodies coupled to FITC or Cy3, respectively. To overexpress an unrelated protein as control, cells were transfected with plasmid pTL-FLAG-endophilin-A3. Nuclei were stained with Hoechst. Bars, 10 μm. Arrows indicate transfected cells.
Figure 5.
Figure 5.
Overexpression of ATXN2 does not influence SG formation. DU145 cells were transiently transfected with plasmid pCMV-MYC-ATXN2-Q22. Eight hours post transfection, cells were treated with 0.5 mM arsenite for 1 h. Control cells were left untreated at 37°C. For visualization of MYC-tagged ATXN2, cells were incubated with an antibody directed against the MYC-tag and antibodies against DDX6 (A) or TIA-1 (B) under normal and oxidative stress conditions as indicated. Arrows indicate transfected cells. Nuclei were stained with Hoechst. Bars, 10 μm.
Figure 6.
Figure 6.
A reduced ATXN2 level prevents SG assembly. Top, HEK293T cells were cotransfected with a mix of siATXN2#2 and siATXN2#3 molecules. As controls, siControl#1 and siControl#2 were used as indicated. Sixty-eight hours post transfection, cells were incubated with 0.5 mM arsenite for 1 h. Nuclei were stained with Hoechst. Bars, 10 μm. Bottom, quantitative analysis. The percentage of TIA-1–positive SGs in control cells versus knockdown cells was determined using the AxioVision software. The number of cellular SGs was counted in each picture taken and divided through the cell number. The mean value of SGs in the cells counted was calculated and SD was weighted. Finally, the number of SGs counted for the control cells was set as 100%, and the number of SGs counted for the knockdown cells was aligned.
Figure 7.
Figure 7.
A reduced ATXN2 level does not seem to affect P-body structures. HEK293T cells were transfected with siControl#1, siATXN2#3, or siATXN2#6 molecules or with transfection reagent only (mock). Endogenous levels of ATXN2 and DDX6 were visualized using antibodies against ATXN2 and DDX6. White boxes represent areas represented enlarged in the adjacent picture column. Nuclei were stained with Hoechst. Bars, 10 μm.
Figure 8.
Figure 8.
The endogenous PABP level is increased in the presence of a low intracellular ATXN2 level. (A) Knockdown studies. HEK293T cells were transfected with siControl#1, esiATXN2, siATXN2#3, or siATXN2#6. Endogenous levels of ATXN2 and PABP were visualized using antibodies against ATXN2 and PABP. (B) Western blot analysis. HEK293T cells transfected with siControl#1, siControl#2, siATXN2#2, siATXN2#3, siATXN2#6, esiATXN2, or transfection reagent (mock) were lysed. The same amount of each protein lysate was separated by SDS-PAGE and transferred to a nitrocellulose membrane. Antibodies directed against ATXN2, PABP, and TIA-1 were used for visualization of proteins. For presentation, the image was juxtaposed using Adobe Photoshop and Illustrator software (Adobe Systems, Mountain View, CA). (C) Quantitative real-time RT-PCR analysis of ATXN2 mRNA knockdown. Seventy-two hours after transfection, RNA from the treated cells was recovered and reverse transcribed. Target ATXN2 and PABP RNA levels were measured by quantitative real-time RT-PCR by using TaqMan assays. Values derived from quantitative real-time RT-PCR of control mock cells (transfected only with transfection reagent) were set as 100%, and the relative expression levels of cells transfected with ATXN2 siRNAs are indicated. Input cDNA in the different samples was normalized using real-time data for β-actin (ACTB). RNA levels are representative of five independent experiments. Error bars indicate SD.
Figure 9.
Figure 9.
ATXN2 overexpression reduces the endogenous PAPB level. Top, HEK293T cells were transfected with plasmids encoding MYC-ATXN2(Q22) or MYC-ATXN2(Q79) proteins. Twenty-four hours post transfection, proteins were visualized with antibodies directed against the MYC-tag and PABP, respectively. Nuclei in all images presented were stained with Hoechst. Bars, 10 μm. Arrows indicate nontransfected cells. Bottom, Western blot analysis. HEK293T transiently overexpressing MYC-ATXN2(Q22) or MYC-ATXN2(Q79) proteins were lysed. The same amount of each protein lysate was separated by SDS-PAGE and transferred to a nitrocellulose membrane or stained with Coomassie to demonstrate equal loading of each lysate. Antibodies directed against ATXN2, PABP, and TIA-1 were used for visualization of proteins.

References

    1. Achsel T., Stark H., Luhrmann R. The Sm domain is an ancient RNA-binding motif with oligo(U) specificity. Proc. Natl. Acad. Sci. USA. 2001;98:3685–3689. - PMC - PubMed
    1. Albrecht M., Golatta M., Wullner U., Lengauer T. Structural and functional analysis of ataxin-2 and ataxin-3. Eur. J. Biochem. 2004;271:3155–3170. - PubMed
    1. Anderson P., Kedersha N. Stressful initiations. J. Cell Sci. 2002a;115:3227–3234. - PubMed
    1. Anderson P., Kedersha N. Visibly stressed: the role of eIF2, TIA-1, and stress granules in protein translation. Cell Stress Chaperones. 2002b;7:213–221. - PMC - PubMed
    1. Anderson P., Kedersha N. RNA granules. J. Cell Biol. 2006;172:803–808. - PMC - PubMed

Publication types

MeSH terms