. 2007 Mar 14:13:374-87.

Control of PDGF-induced reactive oxygen species (ROS) generation and signal transduction in human lens epithelial cells

Affiliations

Control of PDGF-induced reactive oxygen species (ROS) generation and signal transduction in human lens epithelial cells

Kate Chao-Wei Chen et al. Mol Vis. .

Abstract

Purpose: The mitogenic action of PDGF has been shown to associate with reactive oxygen species (ROS) generation, but the mechanism leading to ROS production and subsequent cell proliferation is not clear. We investigated the upstream membrane-bound target proteins involved in PDGF-stimulated signal transduction in human lens epithelial cell (HLE B3), using specific inhibitors and transfected cells.

Methods: PDGF (1 ng/ml)-stimulated ROS generation was measured using fluorescent reaction of DCFDA by confocal microscope in live HLE B3 cells. Western blot analysis was used to determine the activated MAP kinases in cell lysates. Specific inhibitors used in this study were: AG1296 for PDGF receptor (PDGFR); AG1517 for EGF receptor (EGFR); pertussis toxin for cytokine-binding G protein coupled receptor (GPCR); PP1 for Src-family kinases; LY294002 for phosphatidylinositol-3 kinase (PI3K). Small GTP-binding proteins Rac and Ras were studied using transfectants of dominant negative Rac (Rac N17), Ras (Ras N17) or constitutively active Rac (Rac V12). Cell proliferation was quantified using BrdU incorporation method.

Results: Inhibitions of PDGF receptor kinase, the docking protein component Src-family kinases, and the survival element PI3K all eradicated PDGF-stimulated ROS production and corroborated with the suppressed cell growth. These inhibitions also attenuated the activated ERK1/2, JNK, and Akt, all downstream targets of the above factors. Interestingly, inhibiting GPCR or EGFR also showed the same effect but to a lesser degree. Co-inhibiting receptors to PDGF and EGF with or without co-inhibiting GPCR eradicated the PDGF signaling system completely. Transiently transfected cells with plasmid from small GTP-binding proteins Rac N17 or Ras N17 diminished PDGF action in ROS generation, cell proliferation and MAP kinase activation, while cells with Rac V12 enhanced the PDGF effect.

Conclusions: Our data clarified the potential mechanism of PDGF signaling in the lens epithelial cells, in which concerted efforts of the upstream components of PDGF receptor kinase, Src-family kinases, PI3K, Rac, and Ras proteins are required. This report also provided novel findings that GPCR and EGF receptors may control PDGF signaling in the lens epithelial cells via integrative signaling and transactivation mechanisms, respectively.


Figures

Figure 1
Figure 1
Confocal images of intracellular ROS generation upon platelet-derived growth factor (PDGF) stimulation in live HLE B3 cells. Live HLE B3 cells were preloaded with DCFDA (50 μM) to capture the ROS generated upon PDGF (1 ng/ml) stimulation. Confocal cell images represent a random field after PDGF exposure. For further details see Methods. A: Panels from left to right in following conditions: control cells (no PDGF); control cells (with PDGF); PDGF-stimulated cells pretreated with PDGF receptor inhibitor, AG1296 (20 μM, 30 min); PDGF-stimulated cells pretreated with Src inhibitor, PP1 (10 μM, 30 min); PDGF-stimulated cells pretreated with PI3K inhibitor, LY294002 (15 μM, 30 min); and PDGF-stimulated cells pretreated with inhibitor to G-protein coupled receptor, pertussis toxin or Ptx (500 ng/ml, 1 h). B: Bar graph corresponding to the confocal images in A. The DCF fluorescent intensity was quantified using Confocal Assistant 4.02, and expressed as percent increase normalized to control (100%). The data are expressed as mean±SD with n=3. Each p value was obtained by using inhibitor against control (with PDGF). The asterisk indicates a p<8x10⁻⁵.
Figure 2
Figure 2
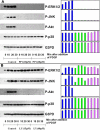
Effect of receptor inhibition on PDGF-activated MAP kinases in HLE B3 cells. Serum-deprived cells with and without inhibitor preloading were stimulated with PDGF (1 ng/ml) for 0, 10, 20, and 30 min, harvested and then lysed in lysis buffer. Cell lysates were applied on 10% SDS-PAGE, transblotted and probed with specific antibodies to P-ERK1/2, P-JNK, P-Akt, P-p38, and G3PD, respectively. A: Cells were stimulated with PDGF with and without preloading (2.5 h) of PDGF receptor inhibitor, AG1296 (20 μM). B: Cells were stimulated with PDGF with and without preloading (2.5 h) with EGF receptor inhibitor, AG1517 (1 μM). C: Cells were stimulated with PDGF with and without preloading (2.5 h) with pertussis toxin (Ptx, 500 ng/ml). D: Cells were stimulated with and without preloading (2.5 h) with AG1296 (20 μM) + AG1517 (1 μM), or AG1296 (20 μM) + AG1517 (1 μM) + Ptx (500 ng/ml). E: Cells were stimulated with and without preloading (overnight) with AG1296 (20 μM) + Ptx (250 ng/ml). Cells without treatment of inhibitors but with stimulation of PDGF (1 ng/ml) were used as the controls. The bar graph with averaged pixel values of the band intensities for each western blot is shown. Data presented are a typical representation of triplicate experiments.
Figure 3
Figure 3
Effect of Src and PI3K inhibition on PDGF-stimulated MAP Kinases in HLEB3 cells. Serum-deprived cells with and without inhibitor preloading were stimulated with PDGF (1 ng/ml) for 0, 10, 20, and 30 min, harvested and then lysed in lysis buffer. Cell lysates were applied on 10% SDS-PAGE, transblotted and probed with specific antibodies to P-ERK1/2, P-JNK, P-Akt, P-p38, and G3PD, respectively. A: Cells were stimulated with PDGF with and without preloading (30 min) of Src inhibitor, PP1, at 10 μM or 20 μM. B: Cells were stimulated with PDGF with or without preloading (30 min) of PI3K inhibitor, LY294002 at 15 μM or 40 μM. Cells without treatment of inhibitor but with stimulation of PDGF (1 ng/ml) were used as the control. The bar graph with averaged pixel values of the band intensities for each western blot is shown. Data presented are a typical representation of 2-3 separate experiments.
Figure 4
Figure 4
Determination of PDGF-stimulated cell proliferation in the presence or absence of inhibitors by BrdU incorporation assay. DNA synthesis induced by PDGF (1 ng/ml, 60 min) in cells with and without pretreatment of PDGF receptor inhibitor, AG1296 (20 μM, overnight), Src inhibitor, PP1 (10 μM, 30 min), PI3K inhibitor, LY294002 (30 μM, 30 min) or GPCR inhibitor, pertussis toxin (500 ng/ml, overnight) was measured by BrdU incorporation. Control cells (no inhibitor), were included for comparison. The data are expressed as relative luminescence unit (RLU)/sec, with mean±SD (n=12). The results are from 3 separate experiments. Each p value was obtained by using inhibitor (with PDGF) against control (with PDGF). The asterisk indicates a p<0.001 and the double asterisk denotes a p<0.026.
Figure 5
Figure 5
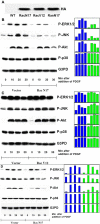
Western blot analysis of PDGF-activated MAP kinases in Ras or Rac transfected human lens epithelial B3 cells. Serum-deprived transiently transfected cells with and without inhibitor pretreatment were stimulated with PDGF (1 ng/ml) for 0, 10, 20, and 30 min, harvested and then lysed in lysis buffer. The vector-transfected cells were used as control. Cell lysates were applied on 10% SDS-PAGE, transblotted and probed with specific antibodies to HA, P-ERK1/2, P-JNK, P-Akt, P-p38, and G3PD. A: Wild type (WT) and transfected cells (Rac N17, Rac V12, Ras N17) were probed with anti-HA antibody. B: Vector- or Rac N17-transfected cells stimulated with PDGF were probed for P-ERK1/2, P-JNK, P-Akt, P-p38, and G3PD. C: Vector- or Rac V12-transfected cells stimulated with PDGF were probed for P-ERK1/2, P-JNK, P-Akt, P-p38 and G3PD. D: Vector- or Ras N17-transfected cells stimulated with PDGF were probed for P-ERK1/2, P-JNK, P-Akt, P-p38 and G3PD. The bar graph with averaged pixel values of the band intensities for each western blot is shown. Data presented are a typical representation of 2-3 separate experiments.
Figure 6
Figure 6
Confocal images of intracellular ROS generation upon PDGF stimulation in live Ras or Rac transfected cells. Serum starved transiently transfected cells were preloaded with DCFDA (50 μM) to capture the ROS generated upon PDGF (1 ng/ml) stimulation. Confocal cell images represent a random field after PDGF exposure. For details see Methods. A: Panels from left to right are: Negative control cells (vector transfected, no PDGF); positive control cells (vector transfected, with PDGF), dominant negative Rac transfected cells (Rac N17, with PDGF), constitutively active Rac tansfected cells (Rac V12, with PDGF), and dominant negative Ras transfected cells (Ras N17, with PDGF). B: Bar graph corresponding to the confocal images in A. The DCF fluorescent intensity was quantified using Confocal Assistant 4.02, and expressed as precent increase normalized to control (100%). The data are expressed as mean±SD with n=3. Each p value was obtained by using mutant transfectant against vector trasnfectant (with PDGF). The asterisk indicates a p<2x10⁻⁵ and the double asterisk denotes a p<0.03.
Figure 7
Figure 7
Determination of PDGF-stimulated cell proliferation in Ras or Rac transfected cells by BrdU incorporation assay. DNA synthesis was measured with or without addition of PDGF (1 ng/ml, 60 min) in transient tranfectants: vector (control), Rac N17, Ras N17, and Rac V12. The data are expressed as relative luminescence unit (RLU)/sec with mean±SD (n=12). The results are from 3 separate experiments. Each p value was obtained by using mutant transfectant (with PDGF) against vector transfectant (with PDGF). The asterisk indicates a p<1x10⁻⁷.
Figure 8
Figure 8
The proposed mechanism of PDGF signaling in the lens epithelial cells. The solid line indicates the known or published pathway and the dashed line represents proposed new pathway. In the figure, EGF denotes Epidermal growth factor, GPCR indicates G protein coupled receptor, PI3K indicates phosphatidyl inositol-3-kinase, cPLA2 denotes cytosolic phospholipase 2, PL indicates Phospholipid, AA denotes Arachidonic acid, PKC indicates protein kinase C, and ROS denotes Reactive oxygen species.

References

    1. Cerutti PA. Prooxidant states and tumor promotion. Science. 1985;227:375–81. - PubMed
    1. Chen Z, Silva H, Klessig DF. Active oxygen species in the induction of plant systemic acquired resistance by salicylic acid. Science. 1993;262:1883–6. - PubMed
    1. Levine A, Tenhaken R, Dixon R, Lamb C. H2O2 from the oxidative burst orchestrates the plant hypersensitive disease resistance response. Cell. 1994;79:583–93. - PubMed
    1. Burdon RH. Superoxide and hydrogen peroxide in relation to mammalian cell proliferation. Free Radic Biol Med. 1995;18:775–94. - PubMed
    1. Finkel T. Oxygen radicals and signaling. Curr Opin Cell Biol. 1998;10:248–53. - PubMed

MeSH terms

LinkOut - more resources