. 2007 Mar 29:8:108.
doi: 10.1186/1471-2105-8-108.

Transcript-based redefinition of grouped oligonucleotide probe sets using AceView: high-resolution annotation for microarrays

Affiliations

Transcript-based redefinition of grouped oligonucleotide probe sets using AceView: high-resolution annotation for microarrays

Jun Lu et al. BMC Bioinformatics. .

Abstract

Background: Extracting biological information from high-density Affymetrix arrays is a multi-step process that begins with the accurate annotation of microarray probes. Shortfalls in the original Affymetrix probe annotation have been described; however, few studies have provided rigorous solutions for routine data analysis.

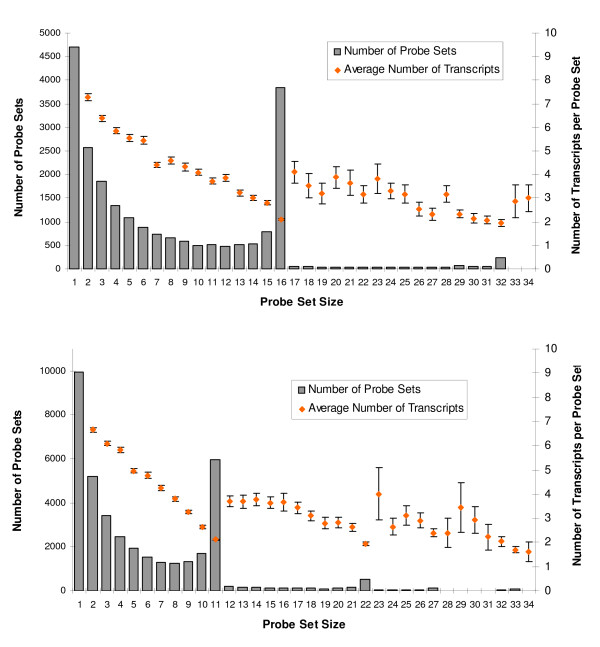
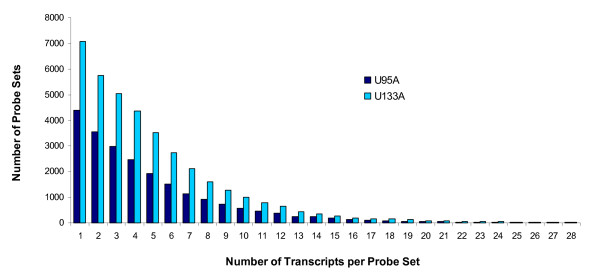
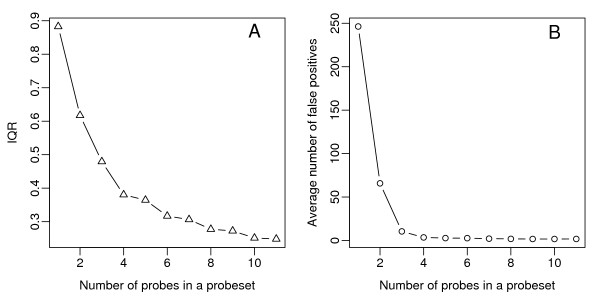
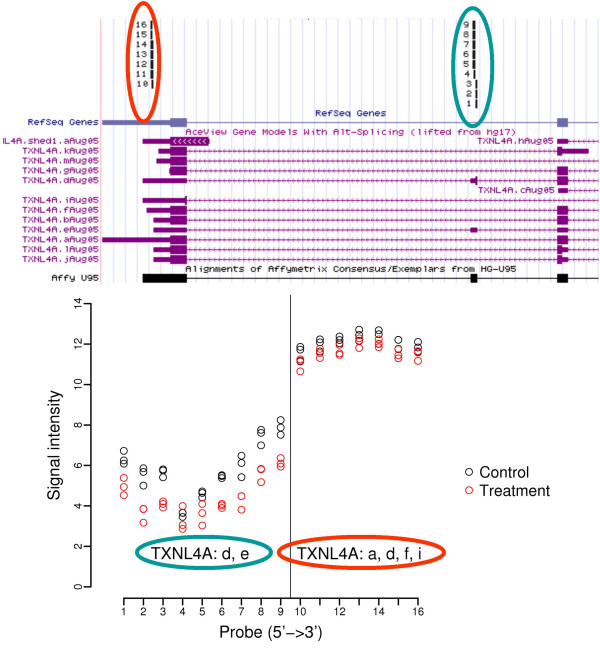
Results: Using AceView, a comprehensive human transcript database, we have reannotated the probes by matching them to RNA transcripts instead of genes. Based on this transcript-level annotation, a new probe set definition was created in which every probe in a probe set maps to a common set of AceView gene transcripts. In addition, using artificial data sets we identified that a minimal probe set size of 4 is necessary for reliable statistical summarization. We further demonstrate that applying the new probe set definition can detect specific transcript variants contributing to differential expression and it also improves cross-platform concordance.

Conclusion: We conclude that our transcript-level reannotation and redefinition of probe sets complement the original Affymetrix design. Redefinitions introduce probe sets whose sizes may not support reliable statistical summarization; therefore, we advocate using our transcript-level mapping redefinition in a secondary analysis step rather than as a replacement. Knowing which specific transcripts are differentially expressed is important to properly design probe/primer pairs for validation purposes. For convenience, we have created custom chip-description-files (CDFs) and annotation files for our new probe set definitions that are compatible with Bioconductor, Affymetrix Expression Console or third party software.


Figures

Figure 1
Figure 1
An example of grouping Affymetrix probes into new probe sets. The top panel shows an AceView diagram demonstrating an example of the regrouping strategy. The Affymetrix probe set "34666_at" (on GeneChip U95Av2) contains 16 probes; 5 probes forming the newly defined probe set b0805_9681 match all three transcript variants (b, c, and i) of SOD2; and 8 probes (b0805_616) match the variants b and c; and the remaining 3 probes (b0805_11137) were mapped to the variant b only. The blue vertical line indicates the exon-intron boundaries or the beginning and ends of transcripts. The bottom panel of the figure shows the log-based 2 signals in the treatment and control groups for each probe. The values from all six samples were drawn here. The probes on x-axis were ordered from 5' to 3' of the gene.
Figure 2
Figure 2
The frequency distribution of the redefined probe set sizes for GeneChips U95A and U133A. The number of probes in a redefined probe set is shown on the x-axis, and the frequency of probe sets is indicated on the left y-axis. The average number of transcripts (+/- SE, right y-axis) mapped by each probe set was also plotted against the probe set size. The upper and lower panels show U95A and U133A, respectively.
Figure 3
Figure 3
The distribution of numbers of matching transcripts by the newly defined probe sets (U95A and U133A chip). The number of matching transcripts (shown on the horizontal axis) was plotted against the frequency of newly defined probe sets (y-axis). About 90% of the new probe sets match 10 transcripts or less.
Figure 4
Figure 4
The effects of probe set size on variability and false positive detection using summarized gene expression measurements. These two figures are generated from data in the summarization table. The numbers of probes used for deriving the summarized expression measurements are plotted on the x-axis against (A) the IQR, used to indicate the level of variation of fold-changes (FC) of non-significant genes, and (B) the average number of false positives (called if FC>2 for non-spike-in probe sets). All data were calculated using all arrays in the U133A Latin Square spike-in data set.
Figure 5
Figure 5
The receiver operating characteristic (ROC) curves for expression measurements derived from various numbers of probes. Comparison of gene expression measurements derived from 3, 4, 5, 6, and 11 probes is shown. The data summarized from 11 probes are the same as those derived from the original Affymetrix probe sets. The average ROC curves for (A) all the comparisons in the Spike-in dataset with fold changes ranging from 2 to 4092, and (B) for comparisons limited to data sets spiked-in at 2-fold.
Figure 6
Figure 6
The interrogation of specific transcripts using the redefined probe sets. The top panel shows the annotation of Affymetrix probes to AceVew transcripts, drawn by BLAT [44]. The Affymetrix probe set "33631_at" (on GeneChip U95Av2) contains 16 probes; 9 probes match two transcript variants (d and e) of TXNL4A, forming a new probe set by our definition (circled in blue); and the remaining 7 probes match the variants a, d, f and I, forming another new probe set (circled in red). The bottom panel of the figure shows the log-based 2 signals for each probe in the treatment and control groups (3 samples in each group). The probes on x-axis were ordered from 5' to 3' of the gene. Notice that the expression values are relatively homogeneous within each new probe set (separated by the vertical line, and the target transcripts were also circled in blue or red). The expression level differences between two groups are most clearly seen in the group on the left side (circled in blue).

Similar articles

Cited by

References

    1. Lockhart DJ, Dong H, Byrne MC, Follettie MT, Gallo MV, Chee MS, Mittmann M, Wang C, Kobayashi M, Horton H, Brown EL. Expression monitoring by hybridization to high-density oligonucleotide arrays. Nat Biotechnol. 1996;14:1675–1680. doi: 10.1038/nbt1296-1675. - DOI - PubMed
    1. Wodicka L, Dong H, Mittmann M, Ho MH, Lockhart DJ. Genome-wide expression monitoring in Saccharomyces cerevisiae. Nat Biotechnol. 1997;15:1359–1367. doi: 10.1038/nbt1297-1359. - DOI - PubMed
    1. Affymetrix MAS5 algorithm. 2006. http://www.affymetrix.com/support/technical/manual/expression_manual.affx
    1. Li C, Wong WH. Model-based analysis of oligonucleotide arrays: expression index computation and outlier detection. Proc Natl Acad Sci U S A. 2001;98:31–36. doi: 10.1073/pnas.011404098. - DOI - PMC - PubMed
    1. Irizarry RA, Hobbs B, Collin F, Beazer-Barclay YD, Antonellis KJ, Scherf U, Speed TP. Exploration, normalization, and summaries of high density oligonucleotide array probe level data. Biostatistics. 2003;4:249–264. doi: 10.1093/biostatistics/4.2.249. - DOI - PubMed

Publication types

MeSH terms

Substances

LinkOut - more resources