

A meta-data based method for DNA microarray imputation
- PMID: 17394658
- PMCID: PMC1852325
- DOI: 10.1186/1471-2105-8-109
A meta-data based method for DNA microarray imputation
Abstract
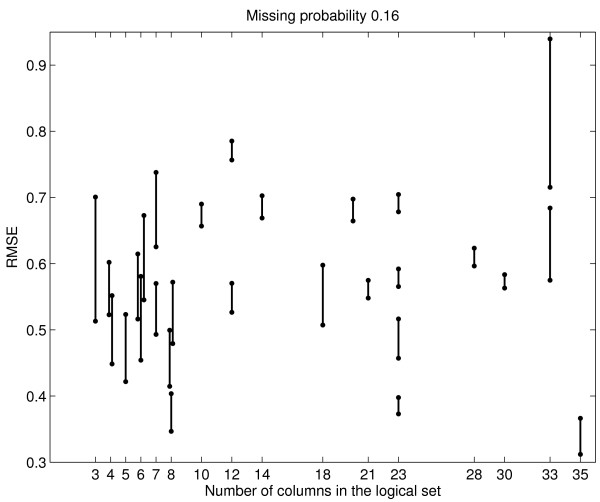
Background: DNA microarray experiments are conducted in logical sets, such as time course profiling after a treatment is applied to the samples, or comparisons of the samples under two or more conditions. Due to cost and design constraints of spotted cDNA microarray experiments, each logical set commonly includes only a small number of replicates per condition. Despite the vast improvement of the microarray technology in recent years, missing values are prevalent. Intuitively, imputation of missing values is best done using many replicates within the same logical set. In practice, there are few replicates and thus reliable imputation within logical sets is difficult. However, it is in the case of few replicates that the presence of missing values, and how they are imputed, can have the most profound impact on the outcome of downstream analyses (e.g. significance analysis and clustering). This study explores the feasibility of imputation across logical sets, using the vast amount of publicly available microarray data to improve imputation reliability in the small sample size setting.
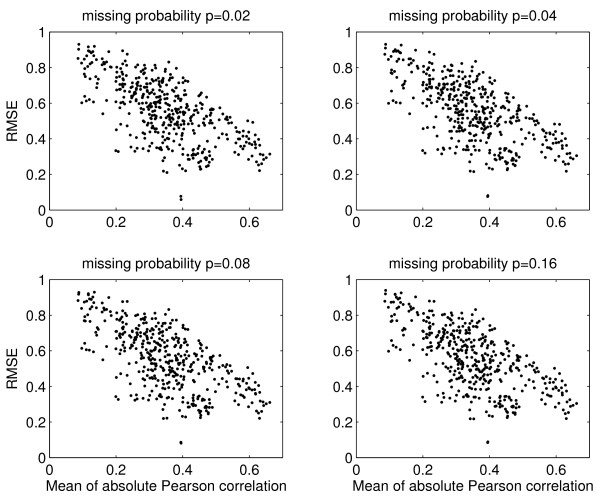
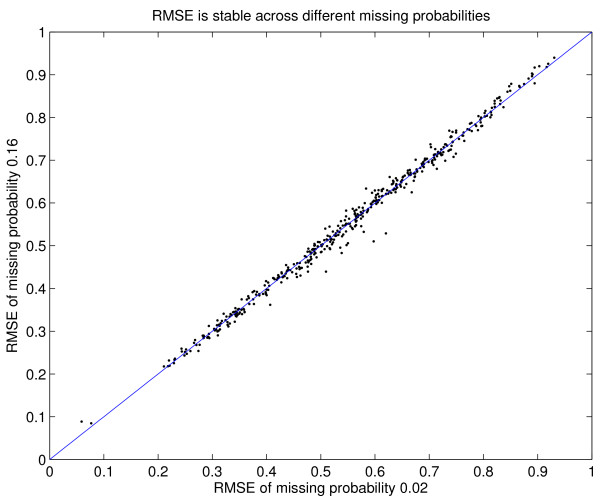
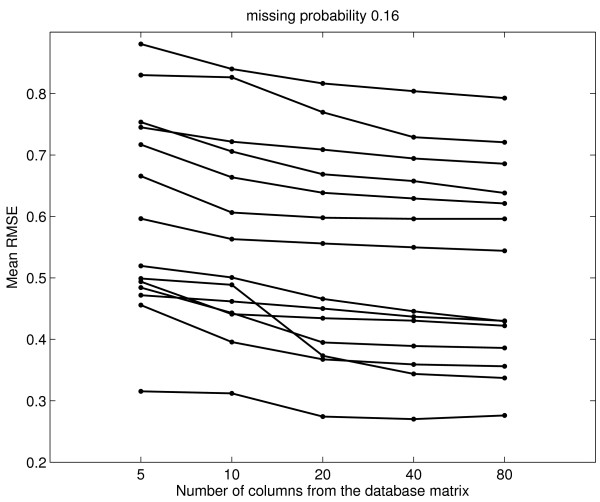
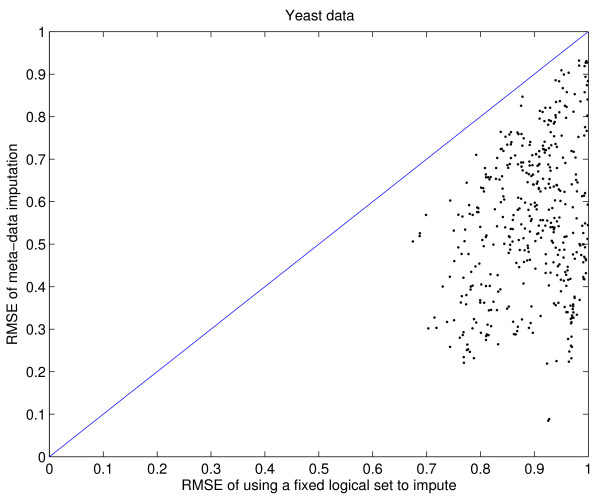
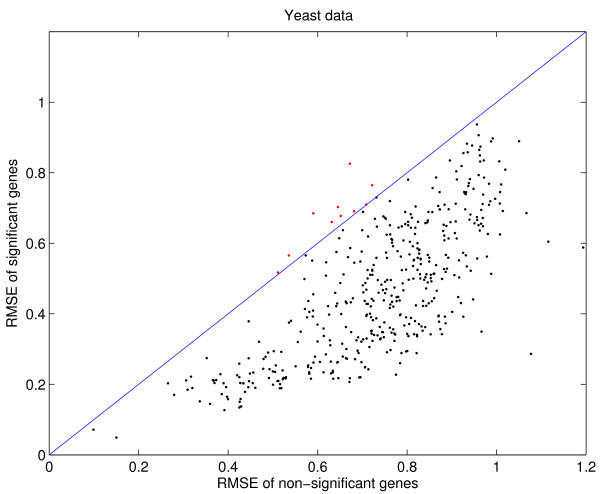
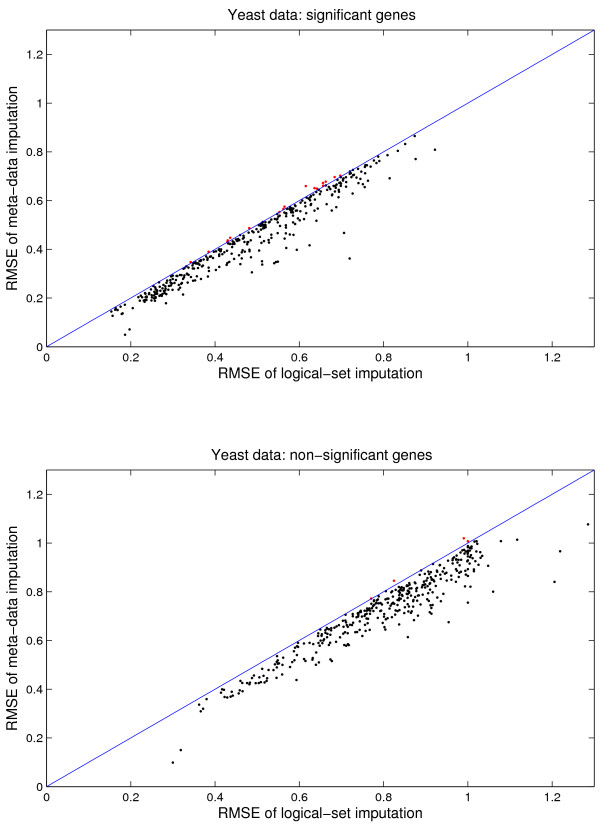
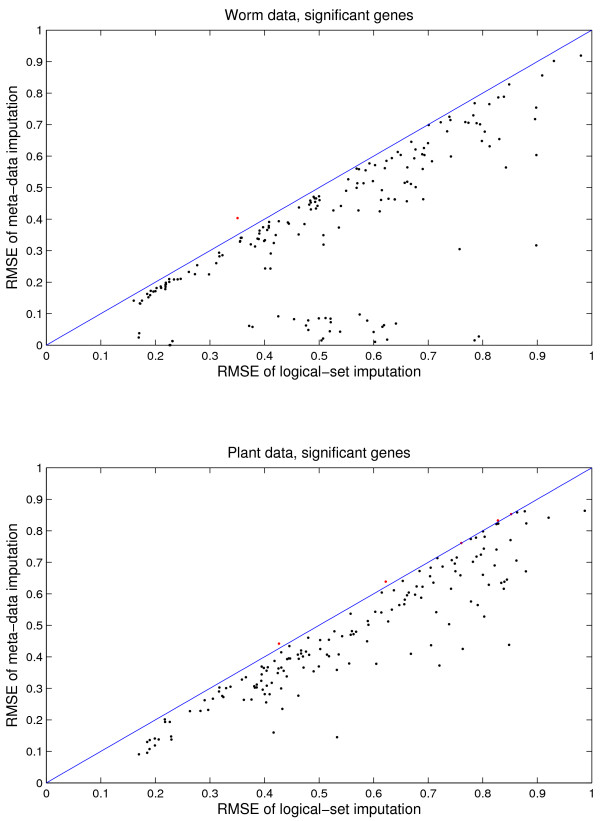
Results: We download all cDNA microarray data of Saccharomyces cerevisiae, Arabidopsis thaliana, and Caenorhabditis elegans from the Stanford Microarray Database. Through cross-validation and simulation, we find that, for all three species, our proposed imputation using data from public databases is far superior to imputation within a logical set, sometimes to an astonishing degree. Furthermore, the imputation root mean square error for significant genes is generally a lot less than that of non-significant ones.
Conclusion: Since downstream analysis of significant genes, such as clustering and network analysis, can be very sensitive to small perturbations of estimated gene effects, it is highly recommended that researchers apply reliable data imputation prior to further analysis. Our method can also be applied to cDNA microarray experiments from other species, provided good reference data are available.
Figures
Similar articles
-
Robust imputation method for missing values in microarray data.BMC Bioinformatics. 2007 May 3;8 Suppl 2(Suppl 2):S6. doi: 10.1186/1471-2105-8-S2-S6. BMC Bioinformatics. 2007. PMID: 17493255 Free PMC article.
-
DNA microarray data imputation and significance analysis of differential expression.Bioinformatics. 2005 Nov 15;21(22):4155-61. doi: 10.1093/bioinformatics/bti638. Epub 2005 Aug 23. Bioinformatics. 2005. PMID: 16118262
-
Towards clustering of incomplete microarray data without the use of imputation.Bioinformatics. 2007 Jan 1;23(1):107-13. doi: 10.1093/bioinformatics/btl555. Epub 2006 Oct 31. Bioinformatics. 2007. PMID: 17077099
-
Towards knowledge-based gene expression data mining.J Biomed Inform. 2007 Dec;40(6):787-802. doi: 10.1016/j.jbi.2007.06.005. Epub 2007 Jun 21. J Biomed Inform. 2007. PMID: 17683991 Review.
-
Dealing with missing values in large-scale studies: microarray data imputation and beyond.Brief Bioinform. 2010 Mar;11(2):253-64. doi: 10.1093/bib/bbp059. Epub 2009 Dec 4. Brief Bioinform. 2010. PMID: 19965979 Review.
Cited by
-
How to improve postgenomic knowledge discovery using imputation.EURASIP J Bioinform Syst Biol. 2009;2009(1):717136. doi: 10.1155/2009/717136. Epub 2009 Feb 8. EURASIP J Bioinform Syst Biol. 2009. PMID: 19223972 Free PMC article.
-
A comparison of imputation procedures and statistical tests for the analysis of two-dimensional electrophoresis data.Proteome Sci. 2010 Dec 15;8:66. doi: 10.1186/1477-5956-8-66. Proteome Sci. 2010. PMID: 21159180 Free PMC article.
-
An efficient ensemble method for missing value imputation in microarray gene expression data.BMC Bioinformatics. 2021 Apr 13;22(1):188. doi: 10.1186/s12859-021-04109-4. BMC Bioinformatics. 2021. PMID: 33849444 Free PMC article.
-
Latent class based multiple imputation approach for missing categorical data.J Stat Plan Inference. 2010 Nov;140(11):3252-3262. doi: 10.1016/j.jspi.2010.04.020. J Stat Plan Inference. 2010. PMID: 30555206 Free PMC article.
-
An integrative imputation method based on multi-omics datasets.BMC Bioinformatics. 2016 Jun 21;17:247. doi: 10.1186/s12859-016-1122-6. BMC Bioinformatics. 2016. PMID: 27329642 Free PMC article.
References
Publication types
MeSH terms
Substances
LinkOut - more resources
Full Text Sources
Molecular Biology Databases
