Comparative Study
. 2007 Apr 18;26(8):2180-91.
doi: 10.1038/sj.emboj.7601665. Epub 2007 Mar 29.

Genomic instability of the host cell induced by the human papillomavirus replication machinery

Affiliations
Comparative Study

Genomic instability of the host cell induced by the human papillomavirus replication machinery

Meelis Kadaja et al. EMBO J. .

Abstract

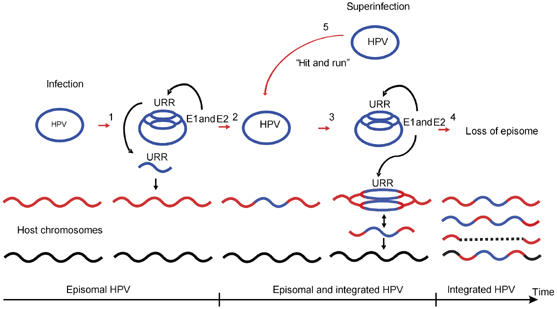
Development of invasive cervical cancer upon infection by 'high-risk' human papillomavirus (HPV) in humans is a stepwise process in which some of the initially episomal 'high-risk' type of HPVs (HR-HPVs) integrate randomly into the host cell genome. We show that HPV replication proteins E1 and E2 are capable of inducing overamplification of the genomic locus where HPV origin has been integrated. Clonal analysis of the cells in which the replication from integrated HPV origin was induced showed excision, rearrangement and de novo integration of the HPV containing and flanking cellular sequences. These data suggest that papillomavirus replication machinery is capable of inducing genomic changes of the host cell that may facilitate the formation of the HPV-dependent cancer cell.


Figures

Figure 1
Figure 1
HPV E1 and E2 proteins initiate the replication from episomal and integrated HPV origins in HeLa cells. (A, B) HeLa cells were cotransfected with plasmids for expression of homologous E2 and E1 from HPV6b (lanes 1–4), HPV11 (lanes 5–8), HPV16 (lanes 9–12) and HPV18 (lanes 13–16) together with 0.5 μg of pUCURR-6b, -11, -16 and -18, respectively. As controls, either 5 μg pMHE1-18 and 5 μg pQMNE2-18 (lanes 17 and 18) or 0.5 μg pUCURR18 alone (lanes 19 and 20) was transfected. A 3 μg measure of total DNA extracted 24 and 48 h after transfection was digested with HindIII/DpnI and analyzed by Southern blotting with radiolabeled pUC probe (A) or all four HPV URR sequences (B). (C) Schematic presentation of the HPV6b, -11, -16 and -18 E1 expression constructs. (D) Analysis of expression of HA epitope-tagged E1 of HPV6b (lanes 1 and 2), HPV11 (lanes 3 and 4), HPV16 (lanes 5 and 6) and HPV18 (lanes 7 and 8) 48 h after transfection with 3F10-HRP antibody. (E) Schematic representation of the episomal HPV18 genome and the integrated HPV18 in HeLa cells (Lazo, 1987; Meissner, 1999). Cellular DNA is shown as dashed line and HPV18 DNA as solid line. Open arrows represent the viral ORFs and noncoding URR is shown as an open box.
Figure 2
Figure 2
Replication of integrated HPV18 is dependent on E1 protein concentration, while E2 has no effect. (A, E) Increasing amounts of HPV18 E1 expression plasmids (from 0.5 to 10 μg) were cotransfected with 1 μg of HPV18 E2 expression vector. Total cellular DNA was extracted 24 h and 48 h after transfection and 3 μg of DNA was digested with HindIII (A) or BamHI (E) and analyzed by Southern blotting with 32P-labeled HPV18 URR probe. (B) Southern blot analysis of HeLa cells transfected with HPV18 E1 vector (5 μg) and an increasing amount of HPV18 E2 vector (0.5–10 μg). DpnI was used to remove input plasmids. (C) Western blot analysis of HPV18 E1 protein expression in HeLa cells 48 h after transfection with 3F10-HRP antibody. (D) Western blot analysis of HPV18 E2 protein with 4E4 antibody. (F) Total cellular DNA was extracted at various time points from cells transfected with 1 μg pQME2-18 and 10 μg pMHE1-18 (lanes 1–6) or from mock-transfected cells (lanes 7–12); 3 μg from each DNA sample was digested with BamHI/DpnI and subjected to Southern blotting analysis with 32P-labeled HPV18 URR-specific probe.
Figure 3
Figure 3
Amplification of integrated HPV16 URR in SiHa cells transfected with HPV E1 and E2 expression vectors. (A) Schematic presentation of the integrated HPV16 genome in chromosome 13 in SiHa cells. Viral ORFs are shown as open arrows and URR is indicated by an open box. Numbers in italics indicate the nucleotides of viral genome at the junction with cellular DNA. Acc65I restriction sites at nt 880 and nt 5378 of the viral genome are shown (B) SiHa cells were transfected with expression vectors for E1 and E2 as follows: 5–20 μg of HPV6b E1 (lanes 1–3); 5–20 μg of HPV11 E1 (lanes 4–6); 1.2–5 μg of HPV16 E1 (lanes 7–9) and 1.2–5 μg of HPV18 E1 (lanes 10–12). A 5 μg measure of homologous E2 expression vectors was added for each transfection. For controls, either 5 μg pMHE1-16 alone (lane 13) or 5 μg pQMNE2-16 alone (lane 14) was transfected into the cells. The total DNA was isolated 24 h after transfection and 3 μg was digested with Acc65I/DpnI and analyzed by Southern blotting using radiolabeled HPV16 URR probe. (C) Analysis of E1 protein expression in SiHa cells 24 h after transfection using Western blot.
Figure 4
Figure 4
Amplification of the integrated HPV16 origin and flanking cellular sequences induced by HR-HPV E1 and E2 proteins. (A) Graphical representation of amplification of HPV16 URR and flanking sequences of two independent experiments, as described in (B). A 5 μg portion of pMHE1-16 and 5 μg pQMNE2-16 (dashed line in panel A and second row in panel B) or 5 μg pMHE1-18 and 5 μg pQMNE2-18 (solid line in panel A and third row in panel B) were transfected into SiHa cells. A 3 μg portion of total cellular DNA was extracted 24 h after transfection, digested with different enzyme combinations (indicated at the top in panel B, restriction sites shown in panel A) and then subjected to Southern blot analysis. Filters were probed with either radiolabeled HPV16 URR (lane 3 in panel B) or with cellular sequences (panel B, lanes 1, 2, 4 and 5) from various distances from both sides of the viral integration (SL1, SL2, SR1 and SR2). The replication signals were quantified on PhosphorImager and normalized to the signal from the mock-transfected SiHa cells. The average increase in copy numbers of different sequences is calculated (shown by vertical italic numbers in the graph in panel A). (C) Graphical representation of the results from two independent experiments, where 5 μg pQMNE2-18 together with increasing amounts of pMHE1-18 (2.5 μg, dotted line; 5 μg, dashed line; 10 μg, solid line) was transfected into SiHa cells. The replication signals were analyzed as described above and the average copy numbers corresponding to different sequences (URR-16, SL1, SL2, SR1, andSR2) are shown in the table (D).
Figure 5
Figure 5
Coreplication of integrated and episomal HPV18 in HeLa cells. (A) Low-molecular-weight DNA was extracted from HeLa cells at 48 and 96 h after transfection and (B) total DNA isolated from transfected HeLa cells at 48 h was analyzed by Southern blotting. A 3 μg portion of pUCHPV18 alone (lanes 2 and 3 in panel A and lane 1 in panel B), together with 10 μg pMHE1-18 (lanes 4 and 5 in panel A and lane 2 in panel B) or 10 μg pMHE1-18 and 2.5 μg pQMNE2-18 (lanes 6 and 7 in panel A and lane 3 in panel B), was transfected into HeLa cells. As controls, HeLa cells were transfected with 1 μg pUC-URR18 and 10 μg pMHE1-18 (lanes 8 and 9 in panel A and lane 4 in panel B), or together with 2.5 μg pQMNE2-18 (lanes 10 and 11 in panel A and lane 5 in panel B). A 5 μg protion of total DNA or half of the material from 60 mm dish (in case of low-molecular-weight DNA) was digested with HindIII/DpnI followed by Southern blot analysis with labeled HPV18 URR probe. Mock transfections (lane 1 in panel A and lane 6 in panel B) as well as 100 pg of HindIII-digested pUCHPV18 and pUC-URR18 are shown (lane 12 in panel A and lane 7 in panel B). (C) Southern blot analysis of the total population (lane 2) and sorted GFP-positive cells (lane 3) cotransfected with 10 μg pUCHPV18 plasmid and 0.5 μg pEGFP-N1. Sample from mock transfection is shown in lane 1. Markers of pUCHPV18 plasmid are shown in lanes 4–7; numbers indicated in the figure correspond to the copy number per cell. The total cellular DNA was extracted 48 h after transfection and 1.6 μg of it (corresponding to 2.5 × 10⁵ diploid cells) was analyzed in each lane as described above. The results from two independent experiments are presented in (D).
Figure 6
Figure 6
Chromosomal rearrangements caused by the replication of integrated HPV16. (A) Southern blot analysis of subclones from SiHa cells transfected with 10 μg pMHE1-16 alone (upper panel, lanes 1–43) or together with 5 μg pQMNE2-16 (lower panel, lanes 1–44). Single cell subcloning was performed 72 h after transfection. Total cellular DNA was extracted from each subclone and 3 μg of DNA was digested with BamHI and analyzed by Southern blot with radiolabeled HPV16 URR probe. Total DNA samples from SiHa cells were used for control (lane 44, upper panel; lane 45, lower panel). (B) HindIII, BglII and BamHI restriction analysis of subclones with rearrangements. Restriction pattern of control cells is shown in lanes 25–27. (C) Restriction map of SiHa chromosome 13 close to the HPV16 integration site. Lengths of the appropriate restriction fragments between two sites are depicted in parentheses. (D) Schematic representation of rearrangements at the HPV16 integration site in the third subclone as determined by DIPS-PCR. See Supplementary data for DNA sequence.
Figure 7
Figure 7
Genomic instability of host cell induced by the HPV replication machinery. Papillomavirus DNA is shown in blue, host cell DNA is colored in red and different regions are represented in black. See text for details.

Similar articles

Cited by

References

    1. Alazawi W, Pett M, Arch B, Scott L, Freeman T, Stanley MA, Coleman N (2002) Changes in cervical keratinocyte gene expression associated with integration of human papillomavirus 16. Cancer Res 62: 6959–6965 - PubMed
    1. Andersson S, Safari H, Mints M, Lewensohn-Fuchs I, Gyllensten U, Johansson B (2005) Type distribution, viral load and integration status of high-risk human papillomaviruses in pre-stages of cervical cancer (CIN). Br J Cancer 92: 2195–2200 - PMC - PubMed
    1. Andreson R, Reppo E, Kaplinski L, Remm M (2006) GENOMEMASKER package for designing unique genomic PCR primers. BMC Bioinformatics 7: 172. - PMC - PubMed
    1. Arias-Pulido H, Peyton CL, Joste NE, Vargas H, Wheeler CM (2006) Human papillomavirus type 16 integration in cervical carcinoma in situ and in invasive cervical cancer. J Clin Microbiol 44: 1755–1762 - PMC - PubMed
    1. Baker CC, Phelps WC, Lindgren V, Braun MJ, Gonda MA, Howley PM (1987) Structural and transcriptional analysis of human papillomavirus type 16 sequences in cervical carcinoma cell lines. J Virol 61: 962–971 - PMC - PubMed

Publication types

MeSH terms

Substances