

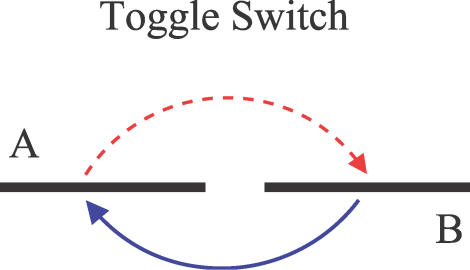
Potential energy landscape and robustness of a gene regulatory network: toggle switch
- PMID: 17397255
- PMCID: PMC1848002
- DOI: 10.1371/journal.pcbi.0030060
Potential energy landscape and robustness of a gene regulatory network: toggle switch
Abstract
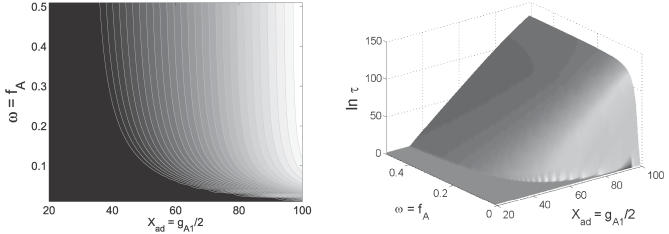
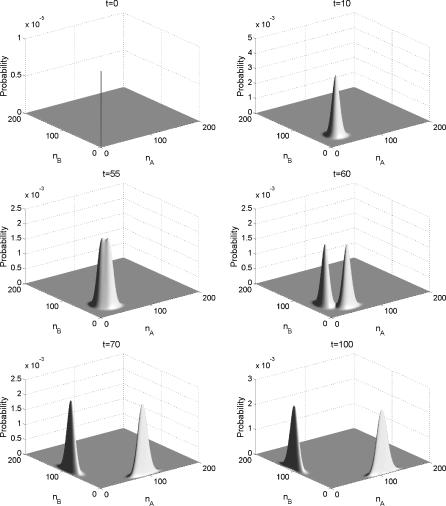
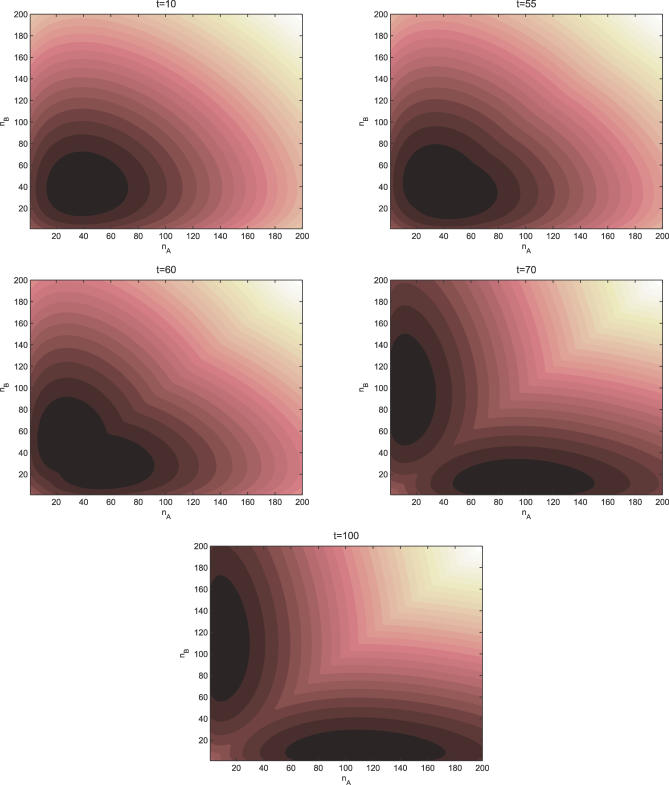
Finding a multidimensional potential landscape is the key for addressing important global issues, such as the robustness of cellular networks. We have uncovered the underlying potential energy landscape of a simple gene regulatory network: a toggle switch. This was realized by explicitly constructing the steady state probability of the gene switch in the protein concentration space in the presence of the intrinsic statistical fluctuations due to the small number of proteins in the cell. We explored the global phase space for the system. We found that the protein synthesis rate and the unbinding rate of proteins to the gene were small relative to the protein degradation rate; the gene switch is monostable with only one stable basin of attraction. When both the protein synthesis rate and the unbinding rate of proteins to the gene are large compared with the protein degradation rate, two global basins of attraction emerge for a toggle switch. These basins correspond to the biologically stable functional states. The potential energy barrier between the two basins determines the time scale of conversion from one to the other. We found as the protein synthesis rate and protein unbinding rate to the gene relative to the protein degradation rate became larger, the potential energy barrier became larger. This also corresponded to systems with less noise or the fluctuations on the protein numbers. It leads to the robustness of the biological basins of the gene switches. The technique used here is general and can be applied to explore the potential energy landscape of the gene networks.
Conflict of interest statement
Figures
References
-
- Davidson EH. The regulatory genome: Gene regulatory networks in development and evolution. New York: Academic Press; 2006. 304
-
- Kholodenko BN. Negative feedback and ultrasensitivity can bring about oscillations in the mitogen-activated protein kinase cascades. Eur J Biochem. 2000;267:1583–1593. - PubMed
-
- Ideker T, Thorsson V, Ranish JA, Christmas R, Buhler J, et al. Integrated genomic and proteomic analyses of a systematically perturbed metabolic network. Science. 2001;292:929–933. - PubMed
-
- Jeong H, Tombor B, Albert R, Oltvai ZN, Barabasi AL. The large-scale organization of metabolic networks. Nature. 2000;407:651–654. - PubMed
Publication types
MeSH terms
Substances
LinkOut - more resources
Full Text Sources
Other Literature Sources
